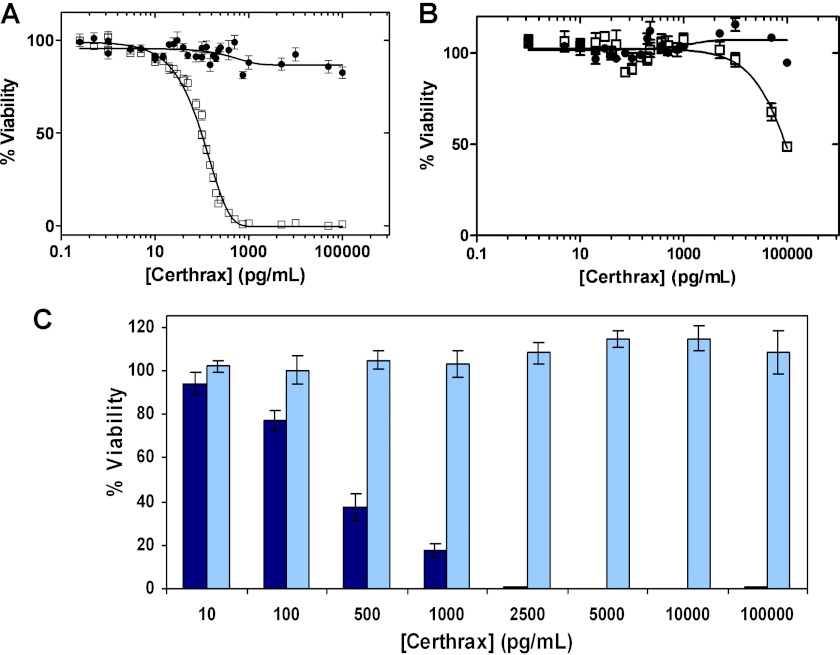
FIGURE 2.
Certhrax cytotoxicity. A, LD50 curve of Certhrax with RAW264.7 cells in the presence (squares) and absence (circles) of 100 ng/ml PA and increasing concentrations of Certhrax. B, LD50 experiment similar to that in A, using R3D cells lacking the protective antigen receptor in the presence (squares) and absence (circles) of 100 ng/ml PA and increasing concentrations of Certhrax. C, effect of Certhrax on mouse macrophage cell growth as indicated by percentage viability of cells 72 h following the addition of 100 ng/ml PA and increasing concentrations of wild-type Certhrax (dark blue) or QXE variant of Certhrax (light blue), where the catalytic Gln and Glu have each been substituted with Ala. In A and B, Certhrax concentrations ranged from 0 to 100,000 pg/ml, and in A–C, cell viability was measured using an MTT colorimetric assay (described under “Experimental Procedures”). Error bars, S.D.

