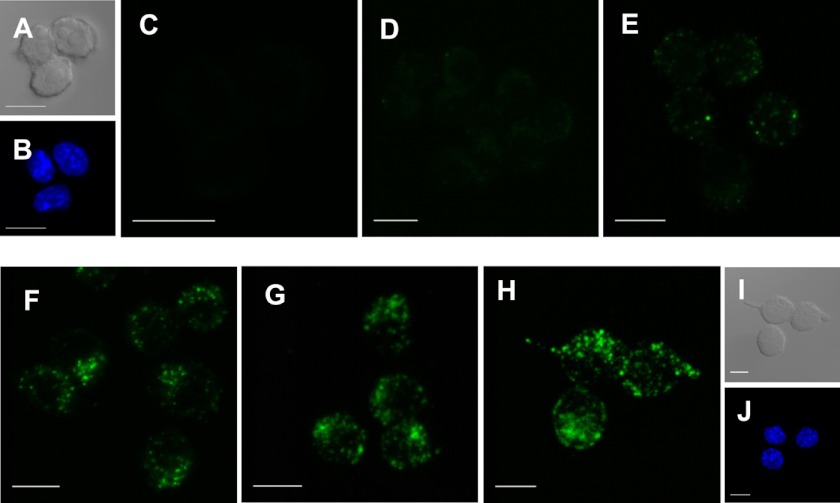
FIGURE 3.
Certhrax host cell entry. A and I, cells under differential interference contrast at 0 min and 24 h, respectively; B and J, DAPI staining at 0 min and 24 h, respectively. C–H, fluorescence confocal microscopy of Certhrax infection of RAW264.7 cells. Cells were fixed and stained with DAPI at varying time points postinfection with DyLight488 fluorophore-labeled Certhrax in the presence of 100 ng/ml PA. C, 0 min; D, 5 min; E, 10 min; F, 20 min; G, 1 h; H, 24 h postinfection. Scale bar, 10 μm.

