FIGURE 2.
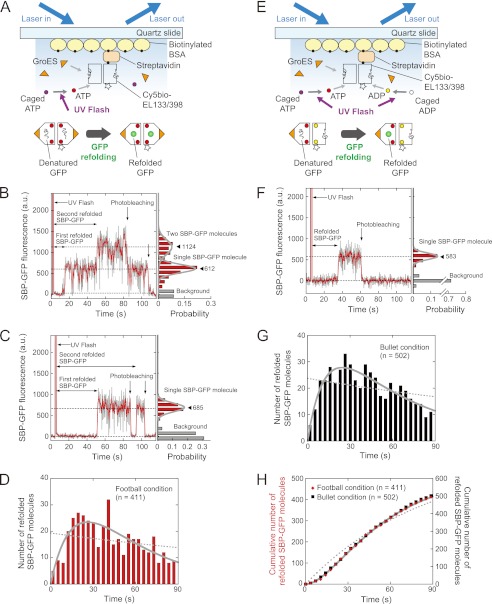
Real time imaging of SBP-GFP folding inside GroEL-GroES complexes. A, schematic illustration of the experiment for SBP-GFP refolding in the football-shaped complex. Cy5-EL133/398 complexed with denatured GFP was immobilized on the quartz slide surface via biotinylated BSA and streptavidin. The final solution contained saturating amounts of GroES and caged ATP, and an oxygen scavenging system. After the photolysis of caged ATP, denatured GFP molecules initiated the folding inside the football-shaped complex. Fluorescence signals from Cy5 and GFP were obtained by prism-type TIRFM. B and C, left panels, time trajectories for the fluorescence intensity of SBP-GFP molecules under the football condition. The second folded SBP-GFP molecule appeared before (B) or after (C) the photobleaching of the first folded SBP-GFP molecule. B and C, right panel, histograms of the fluorescence intensity of SBP-GFP after photolysis. The histograms were fitted by the sum of two Gaussian functions (B) and a Gaussian function (C), respectively. Closed triangles represent the peak of the Gaussian (the mean fluorescence intensity). D, histogram of the time required for the appearance of SBP-GFP fluorescence in the football-shaped complex. The number of molecules is expressed as the sum of the number of the first refolded and second refolded SBP-GFP molecules. The dotted line was fitted to the data by a single exponential function. The solid line was fitted to the data by using Equation 1. E, schematic illustration of the experiment for SBP-GFP refolding in the bullet-shaped complex. The experimental conditions were similar, except that caged ATP and caged ADP were added to the solution. F, left panel, time trajectory for the fluorescence intensity of SBP-GFP molecules under the bullet condition. The fluorescence of single SBP-GFP molecules was observed under the bullet condition. Right panel, histogram of the fluorescence intensity of SBP-GFP after photolysis. The histogram was fitted by using a Gaussian function. G, histogram of the time required for the appearance of SBP-GFP fluorescence in the bullet-shaped complex. The dotted line was fitted to the data by a single exponential function. The solid line was fitted to the data by using Equation 1. H, plots of the cumulative number of refolded SBP-GFP molecules in the football-shaped complex (red diamonds), and the bullet-shaped complex (black squares). In the football condition, the number of molecules is expressed as the sum of the number of the first refolded and second refolded SBP-GFP molecules. The dotted and solid lines represent the fitting curve for the football condition data. The dotted line was fitted to the data by a single exponential function. The solid line was fitted to the data using Equation 2.

