FIGURE 3.
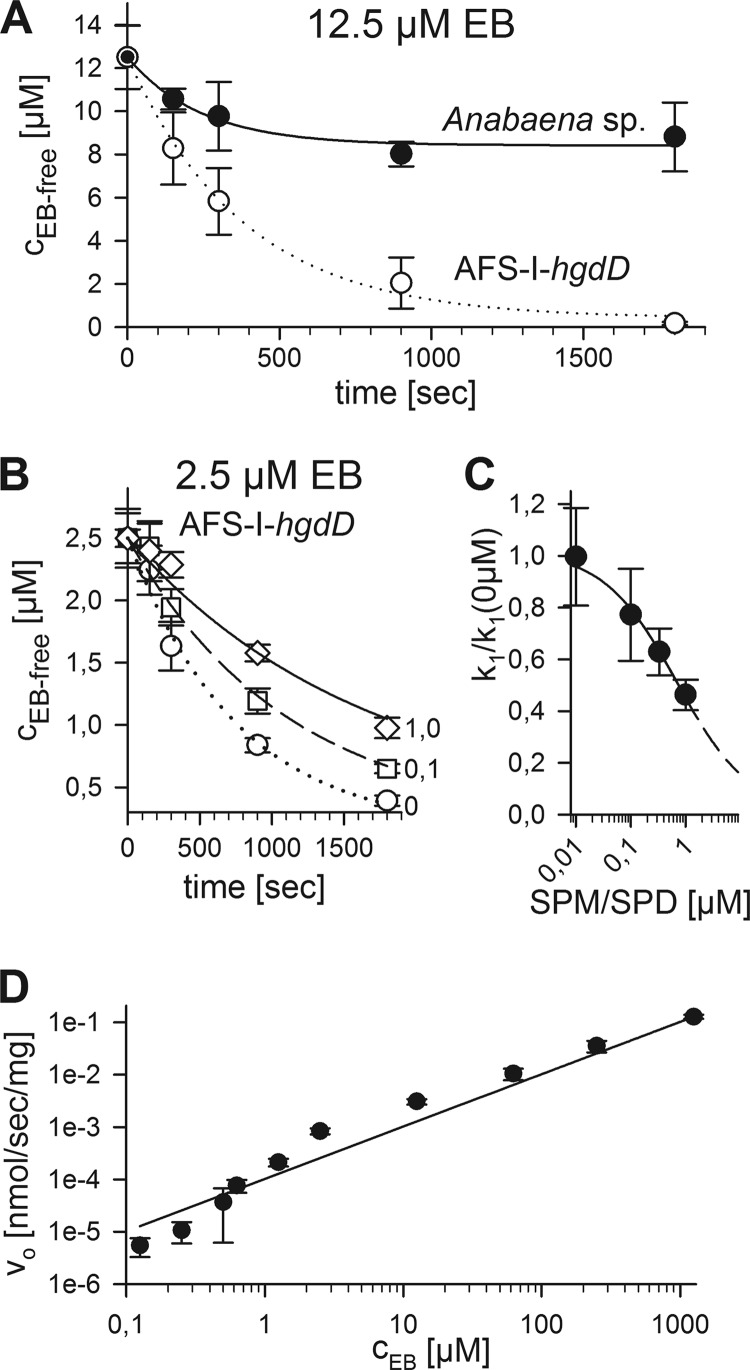
Ethidium uptake by Anabaena sp. and the hgdD mutant by analysis of the extracellular ethidium. A, the EB remaining in solution after incubation of wild type (black) or AFS-I-hgdD (white) with 12.5 μm EB was quantified after the indicated time periods. Lines indicate the analysis according to E1 (Fig. 1). B, the EB remaining in solution after incubation of AFS-I-hgdD with 2.5 μm EB in the presence of 0 (circles), 0.1 (squares), or 1.0 μm spermine/spermidine (diamonds) was quantified after the indicated time periods. Lines indicate the analysis according to E1 (Fig. 1). C, k1 determined in the presence of the indicated concentrations of spermine/spermidine that were set in relation to k1 in the absence of the polyamines. The line represents the least square fit analysis to a four-parameter logistic equation to determine the EC50 value. The dashed line represents the extrapolated result according to the parameters determined. D, the initial uptake rate (v0) was determined from measurements as in A for wild type and plotted against the EB concentration. The line represents the least square fit analysis to the equation described (34). Error bars, standard deviation.

