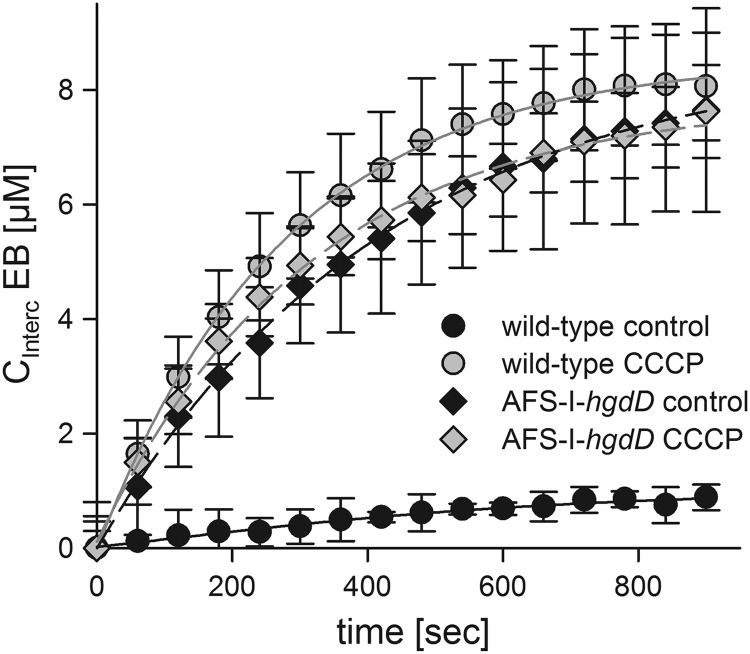
FIGURE 8.
Analysis of ethidium uptake by Anabaena sp. and the hgdD mutant by intercalation. A, ethidium uptake (12.5 μm) in the absence (black) and presence (gray) of CCCP by wild type (circles) or AFS-I-hgdD cells (diamonds) was measured as described under “Experimental Procedures.” Lines represent least square fit analysis by E2 (Fig. 1). Error bars, standard deviation.

