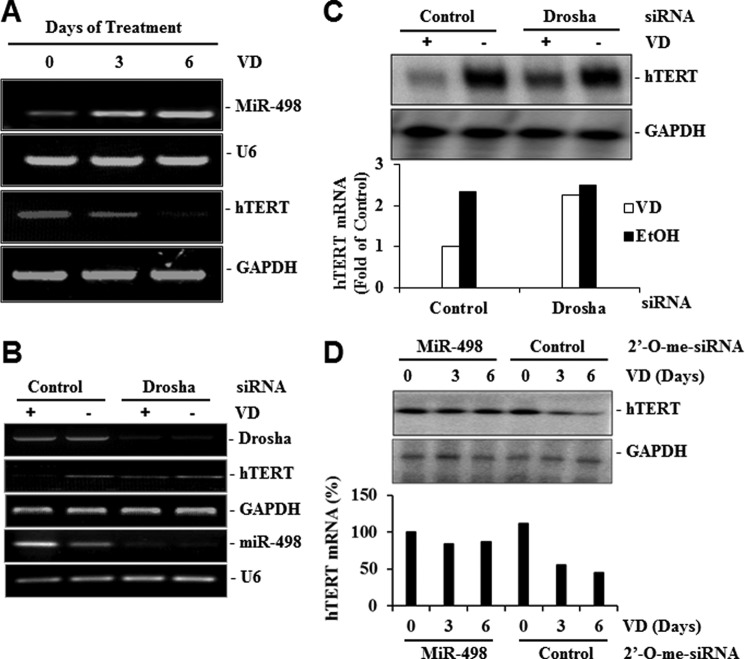
FIGURE 5.
MiR-498 mediates the hTERT down-regulation by VD. A, inverse correlation between hTERT and miR-498 regulation by VD is shown. OVCAR3 cells were treated with EtOH or 10−7 m VD for the indicated days, and miR-498, U6, and hTERT mRNA levels were detected by RT-PCR. B, shown is the effect of Drosha knockdown on the regulation of miR-498 and hTERT by VD. OVCAR3 cells were transfected with control or Drosha siRNA (20 μm). Forty-eight hours later, cells were treated with EtOH or 10−7 m VD for 3 days. Total RNAs were extracted, and RT-PCR analyses were performed. C, RT-PCR products of hTERT and GAPDH from panel B were blotted to nitrocellulose membrane, detected by Southern blot analyses, and quantified by phosphorimaging. The hTERT signals were normalized with cognate GAPDH signals and presented as -fold of the control. D, MiR-498 knockdown diminishes hTERT mRNA down-regulation by VD. OVCAR3 cells were transfected with 2′-O-me-MiR-498 or 2′-O-me-control and treated with 10−7 m VD or EtOH for the indicated times. The hTERT mRNA levels were determined as in panel C and presented in bar graphs as percentage of the time zero. GAPDH was included as a loading control.

