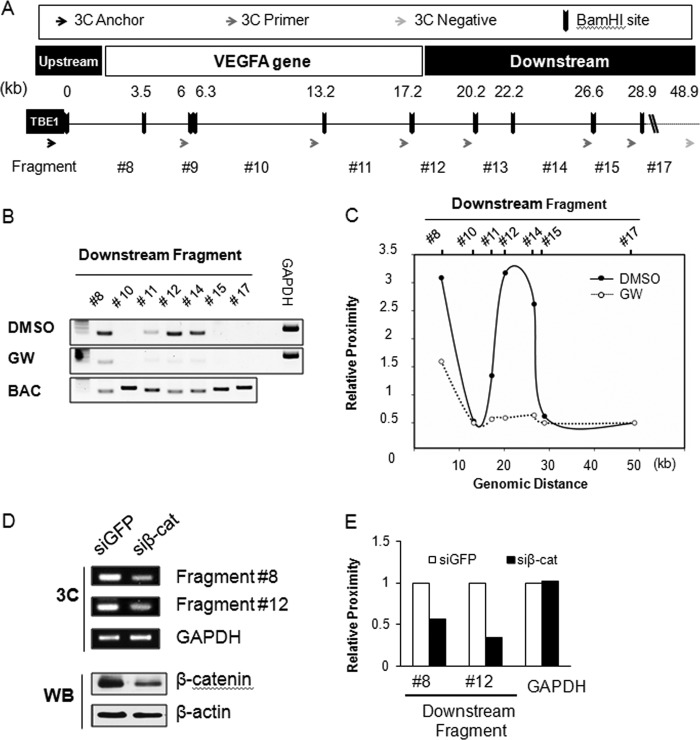
FIGURE 3.
Chromatin looping near the VEGFA gene by β-catenin. A, shown is the design of 3C analysis near the VEGFA gene (−3 to +10 kb). BamHI restriction enzyme sites (black bars) and the resulting fragments are shown as numbers (#) and distances (kb) from the anchor primer (red arrow) at TBE1. The 3C reverse primers pairing the anchor primer are indicated as blue arrows, and the negative primer is shown as a gray arrow. B, 3C analysis with BAC template and with genomic DNA template is shown. Genomic DNAs were extracted from dimethyl sulfoxide or GW501516 (GW)-treated HCT116 cells, and 3C assays were performed. PCR products for detecting each 3C fragment are shown in the order of the genomic BamHI sites from the coding region (#8, #10, and #11) and the downstream regions (#12, #14, #15, and #17) of the VEGFA gene. The gene for glyceraldehyde 3-phosphate dehydrogenase (GAPDH) was used as a loading control (control), and the BAC template was used as a positive control. C, shown is a graphics presentation of the 3C data shown in B after normalizing for PCR efficiency with the BAC template and GAPDH. The x axis is arranged by the genomic distances from the anchor primer, and the y axis marks the relative proximity of the chromosome fragments. D, 3C analysis after β-catenin knockdown is shown. HCT116 cells were transfected with β-catenin small interfering RNA or green fluorescent protein (GFP) siRNA. The 3C assay was performed as described above, and GAPDH was used as loading control (control). β-Catenin protein knockdown was confirmed by Western blot analysis. β-Actin was used as the loading control. E, shown is a graphics representation of the 3C data from siRNA-transfected HCT116 cells. Relative proximity of each fragment #8 and #12 and GAPDH from β-catenin siRNA (siβ-cat)-transfected cells were compared with that of GFP siRNA.

