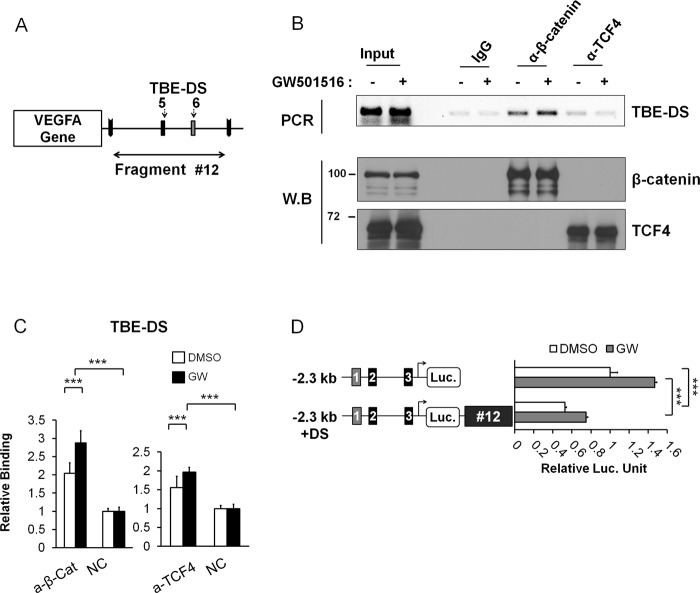
FIGURE 4.
Repression of VEGFA transcription by the binding of β-catenin in downstream fragment #12. A, downstream TBE sites (TBE-DS) located in downstream fragments #12 are shown. BamHI Fragment #12 contained TBE-DS5 and TBE-DS6. B, ChIP analysis of TBE-DS within fragment #12 is shown. Anti-β-catenin and anti-TCF-4 antibodies were employed in addition to IgG control antiserum. Input DNA was also shown. HCT116 cells were grown in serum-free conditions and activated by GW501516. Western blot (W.B) analysis was also performed to confirm the equal use of the input and immunoprecipitation of each protein. C, ChIP-qPCR analysis of downstream TBEs (TBE-DS) is shown. TBE-DS was analyzed for binding with β-catenin (left) and TCF-4 (right). Three independent analyses were performed; the results represent the average ± S.D. (***p < 0.005). NC denotes negative control without antibody. D, shown is a luciferase assay with the VEGFA promoter reporters either with downstream fragment #12 (VEGFA promoter + DS) or without as above. Three independent analyses were performed; the results represent the average ± S.D. (***, p < 0.005).

