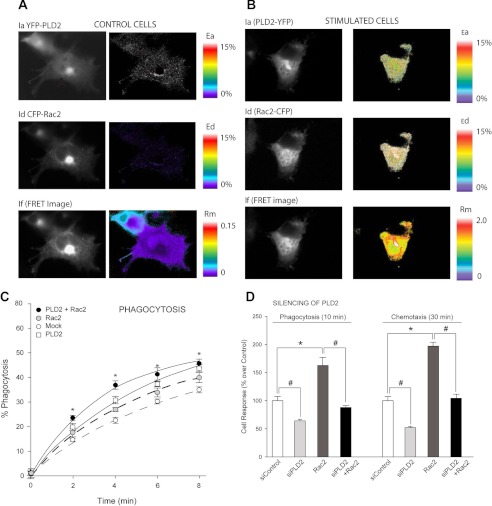
FIGURE 1.
Demonstration of a molecular association in vivo between Rac2 and PLD2 by FRET and the associated physiological relevance. Shown is FRET between YFP-PLD2 and CFP-Rac2 in control (unstimulated) cells (A) and in stimulated RAW264.7 mouse macrophages (EGF, 3 nm, 10 min) (B). The color bars to the far right indicate the magnitude as either % FRET for the acceptor (Ea), YFP-PLD2 and the donor (Ed), CFP-Rac2, respectively, or the ratio of acceptor to donor molecules expressed in the cell (Rm). C, RAW 264.7 cells were transiently overexpressed with PLD2 and/or Rac2. Results from three independent experiments performed in duplicate are shown as the mean ± S.E. and are expressed in terms of percentage phagocytosis, which is calculated by dividing the number of labeled zymosan-containing cells by the total number of cells. D, phagocytosis or chemotaxis in Transwells of RAW 264.7 cells after transfection or silencing is shown. Data are the mean ± S.E. and are expressed as percent of total cells migrated.

