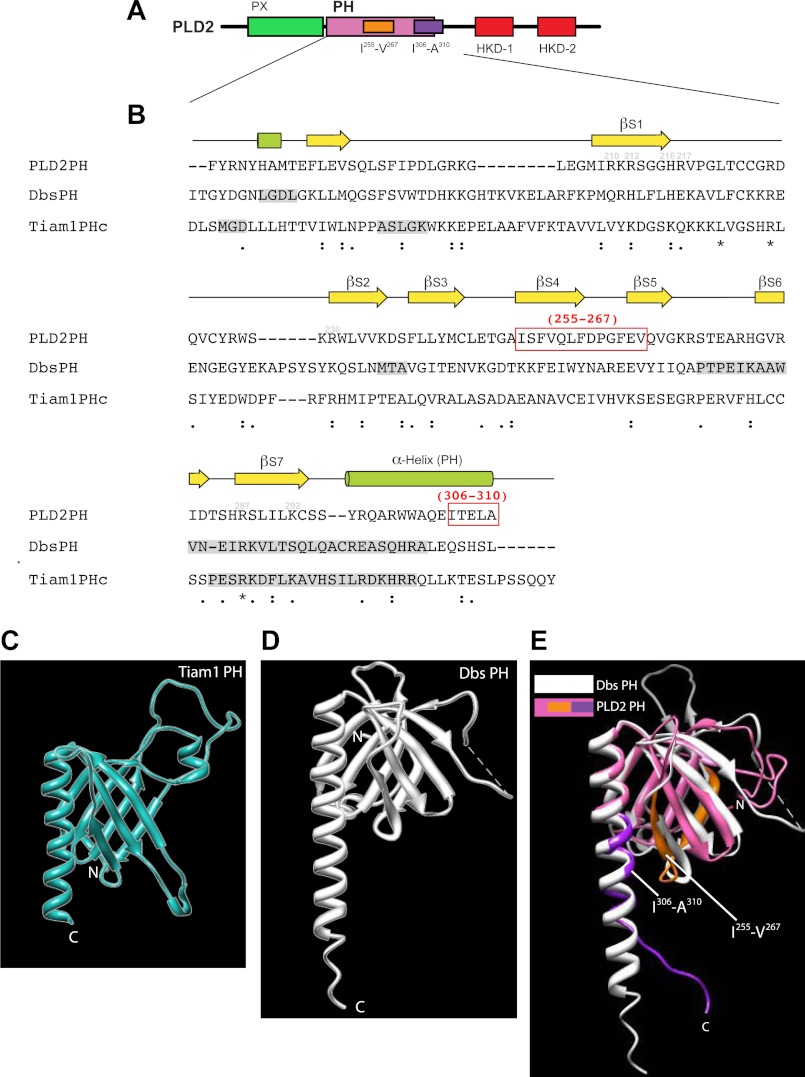
FIGURE 6.
Sequence alignments of PH in PLD2 with PH in Dbs and Tiam1. A, shown is a schematic representation of PLD2 with the PH domain highlighted in magenta. B, shown is a comparative alignment between PLD2-PH, Dbs-PH and Tiam1-PH domains using ClustalW. Ile-255–Val-267 and Ile-306–Ala-310 that were chosen to make deletion mutations are highlighted in red boxes. Identical amino acids, similar amino acids and nearly similar amino acids are shown underneath the sequences as stars, as a single dot or as double dots, respectively. C–E, three-dimensional structure schematics of PLD2 PH and Dbs and Tiam1 PH are shown. The PH domains of Tiam1 (C), Dbs (D) and PLD2 PH are overlaid with Dbs-PH (E). Shown are the Ile-255- Val-267 and Ile-306-Ala-310 regions, as studied in this paper. The three-dimensional structures of PLD2 were obtained by I-TASSER predictions. The PDB IDs that were used to visualize the structures of Dbs and Tiam1 are 1KZ7 and 1FOE, respectively. All structures were viewed using the structure viewer Chimera.

