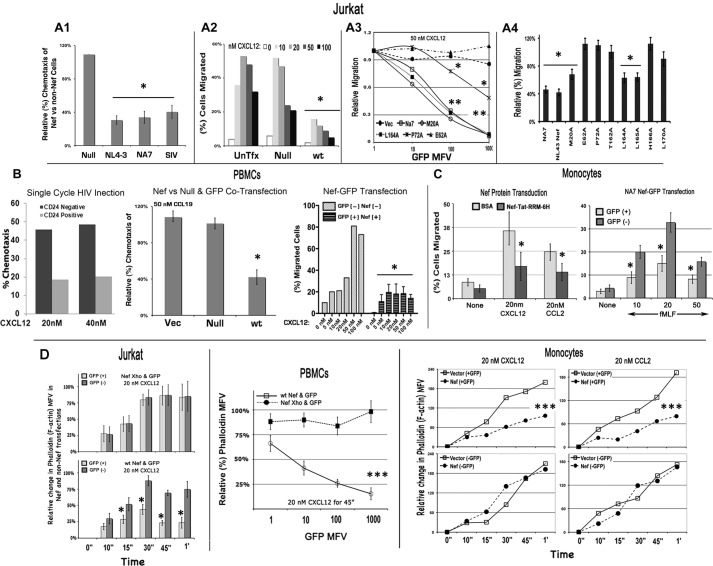
FIGURE 1.
Nef inhibits migration of Jurkat T cells (A1–A4), fresh PBMCs (B), and monocytes (C) toward CXCL12 in a transwell assay and F-actin accumulation in response to CXCL12 or CCL2 (D). Relative (%) chemotaxis of Jurkat cells expressing different Nef alleles (and gated for GFP co-expression) at the optimal peak levels of CXCL12 for cells is illustrated by the histogram (mean with S.E., n = 3; *, p < 0.01) in A1, and a representative CXCL12 dose-response profile of chemotaxis of Nef(−) or Nef(+) cells (n = 3) is illustrated in A2. Relative migration potential of Jurkat cells expressing GFP alone (Vec) or with WT NA7, M20A, P72A, E62A, or L164A mutant from Nef-GFP IRES vector toward CXCR4 is shown as a function of GFP expression in A3 (n = 3). *, p < 0.05; **, p < 0.01, when compared with plasmid-transfected cells. A4, relative (%) chemotaxis of Jurkat cells transfected with CD8 alone or with WT NA7 or NL4–3 Nef allele or M20A, P72A, E62A, or L164A NL4–3 Nef mutant. Chemotaxis data are shown for CD8(+) cells (n = 3). *, p < 0.01 compared with respect to null controls. B, the histogram on the left shows chemotaxis potential of single-cycle Nef(+) HIV-infected (CD24-positive) and uninfected (CD24-negative) CEM cells toward CXCL12. Relative (%) migration potential of CEM cells in WT infected (CD24+) and non-infected (CD24−) population to different concentrations of CXCL12 was assessed by a transwell migration assay. The next histogram (with error bars (S.E.)) shows relative (%) chemotaxis toward CCL19 of PBMCs cotransfected with GFP and WT Nef, null mutant, or empty vector (n = 3, p < 0.02). CXCL12 dose response of chemotaxis (in absolute terms) for Nef(+) GFP(+) versus Nef(−) GFP(+) transfectants is illustrated on the right (n = 3). *, p < 0.05 compared with respective nanomolar concentration. C, histograms with S.E. (n = 3) show the chemotaxis potential toward CXCL12 or CCL2 (left) and formylmethionylleucylphenylalanine (right) of monocytes, transduced for 2 h with BSA or purified Nef fusion protein tagged C-terminally with the arginine-rich motif (RRM) of HIV-1 Tat followed by His6 residues (n = 3). *, p < 0.05. D, time course of F-actin accumulation in Jurkat cells or fresh PBMCs nucleofected with bicistronic (IRES) plasmids encoding WT or null (Nef Xho) Nef and GFP. Histograms (with S.E.) on the left illustrate the F-actin accumulation in GFP(+) versus GFP(−) gated Jurkat cells nucleofected with Nef-Xho-IRES-GFP (top) or Nef-IRES-GFP (bottom) (n = 3). *, p < 0.02. PBMCs nucleofected with Nef-IRES-GFP or NefXho-IRES-GFP were treated with 20 nm CXCL12 for 45 min. Relative (%) F-actin levels (phalloidin mean fluorescence value (MFV)) are plotted as a function of GFP (Nef or NefXho) expression (n = 3). Bars, S.E.; ***, p < 0.01. Alternatively, monocytes were nucleofected with GFP and Nef or an empty vector, and the time course of F-actin accumulation in response to 20 nm CXCL12 or CCL2 was monitored in GFP(−) versus GFP(+) cells (n = 3). ***, p < 0.05.

