
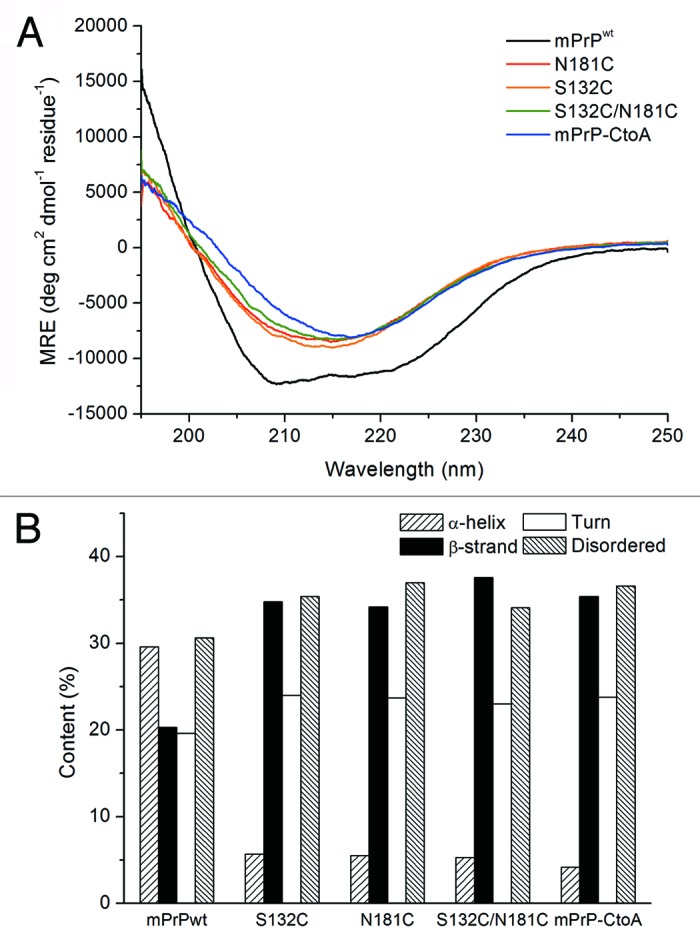
Figure 1. (A) CD spectra of mPrPwt, mPrP-CtoA, S132C, N181C, and S132C/N181C. The proteins were dissolved at a concentration of 0.15 mg/mL in 10 mM NaOAc buffer, pH 7, and their CD spectra immediately recorded. (B) Secondary structure content of each protein determined by CD spectral deconvolution using CDPro software.