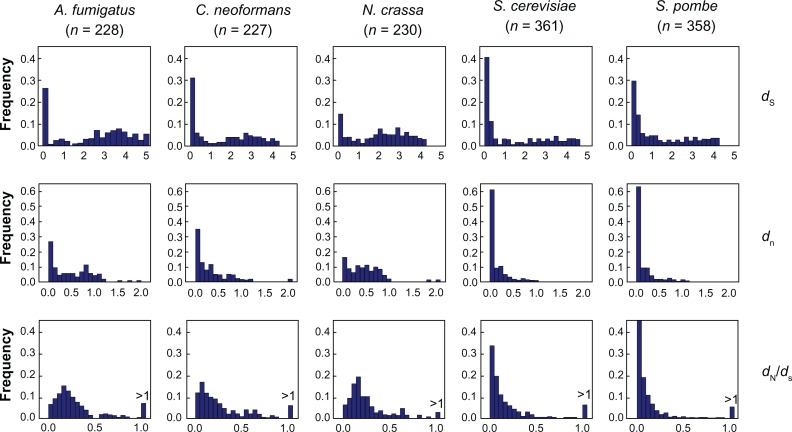
Figure 3.
Distributions of synonymous substitution rate, dS, nonsynonymous substitution rate, dN, and the ratio between nonsynonymous and synonymous substitution rates, dN/dS, versus the frequency of total genes in A. fumigatus, C. neoformans, N. crassa, S. cerevisiae, and S. pombe.
Note: The numbers of gene pairs included in analysis are given in parentheses.

