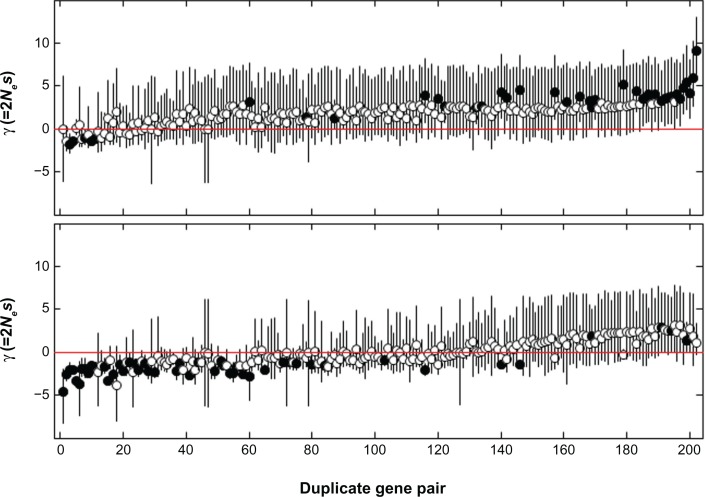
Figure 5.
Means of the posterior distributions of the selection coefficient γ (dots) and the 95% CIs (vertical lines) for duplicate genes in A. fumigatus.
Notes: For each pair of duplicate genes, the copy with larger γ is plotted in the upper panel and the other copy with smaller γ is plotted in the lower panel. Genes that are under positive (95% CIs of γ > 0) or negative selection (95% CIs of γ < 0) are indicated with filled circles. Duplicate gene pairs (x-axis) are ranked by the average values of γ for the two copies of duplicate genes.

