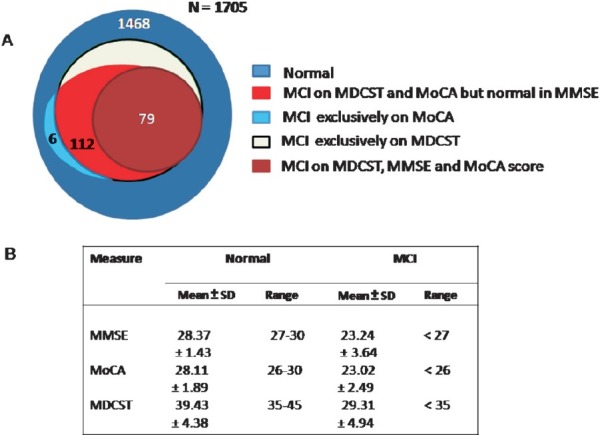
Fig. 2.

Comparison of MDCST, MoCA and MMSE Scores. (A) Graph showing percentage prevalence of MCI in the volunteers when assessed independently by MDCST, MoCA and MMSE. (B) Scores gained Normal and MCI individuals when assessed independently by Multi domain cognitive screening test (MDCST), Montreal cognitive assessment (MoCA) and Mini mental state examination (MMSE).
