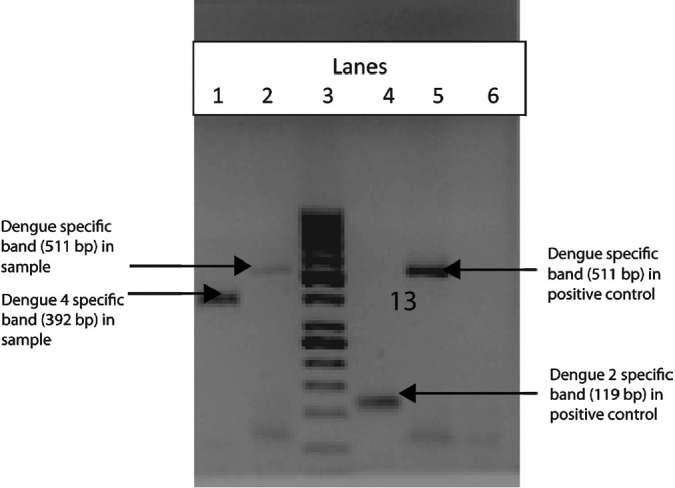
Fig.

nRT-PCR of sample and positive control. Lane 1: nested PCR product of sample showing dengue 4 specific band (392 bp). Lane 2: 1st PCR product of the sample showing dengue specific band (511 bp). Lane 3: Molecular weight marker 1 kb. Lane 4: nested PCR product of positive control showing dengue 2 specific band (119 bp). Lane 5: 1st PCR product of the positive control showing dengue specific band (510 bp). Lane 6: Negative control (NTC).
