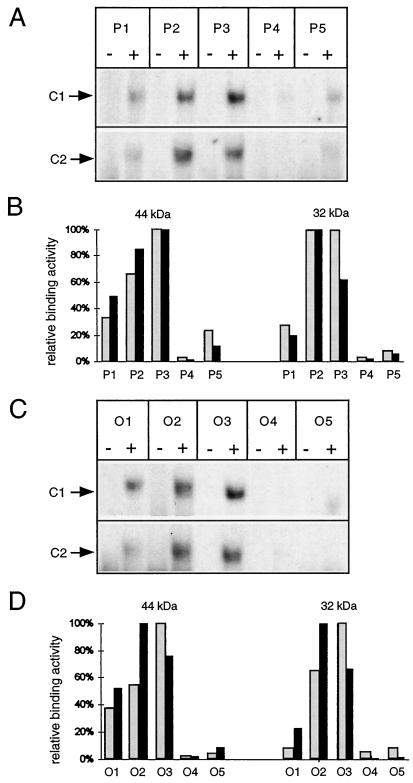
Figure 6.
DNA-binding specificity in different sections of the pea atp9 and the O. berteriana atp1 promoter regions. A and C, Autoradiograms of mobility-shift experiments. rpHPLC fractions containing either the 32-kD protein (fraction no. 49) or the 44-kD protein (fraction no. 51) were used to assay C2 and C1 formation. Complexes are indicated by arrows. The ds-oligonucleotides used in the individual reactions are given at the top. Binding reactions were carried out in the presence (+) or absence (−) of mitochondrial proteins. B and D, Quantitative evaluation of two sets of mobility-shift experiments (autoradiograms in A and C representing one set). Relative binding affinities of the 44- and 32-kD proteins to the individual ds-oligonucleotides were calculated from normalized C1 and C2 signal intensities (see Methods). Gray and black bars represent the relative binding affinities derived from the first and the second data sets, respectively.

