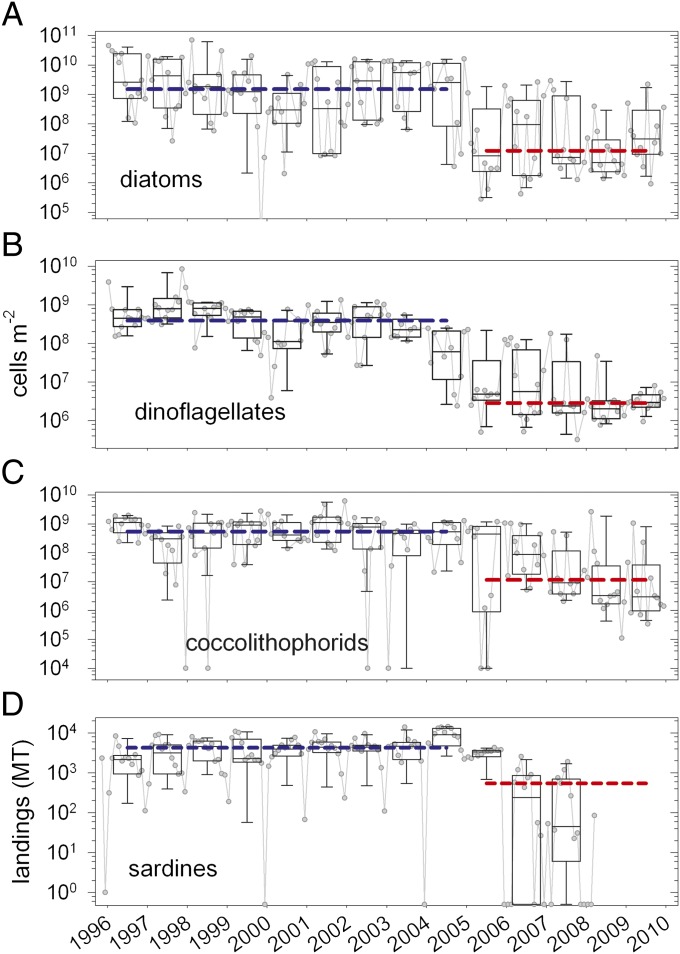
Fig. 3.
Shifts in phytoplankton community composition and sardine landings from the southeastern Margarita Island fishery. Monthly observations presented as gray symbols. Box and whisker plots depict binned annual variations in diatom (A), dinoflagellate (B), coccolithophorid (C) inventories integrated over the upper 55 m and sardine fishery landings (D) in metric tons. Boxes represent the interquartile range of all observations (25th to 75th percentiles). Internal horizontal lines and whiskers are medians and 10th to 90th percentiles, respectively. Blue and red horizontal lines represent the grand medians of all observations between 1996 and 2004 and between 2005 and 2009, respectively. Data in early and late bins are significantly different in all cases (ANOVA; P < 0.001). [Fishery data are courtesy of L. W. Gonzáles (Universidad de Oriente, Boca de Río, Isla de Margarita, Venezuela); zero values artificially set at 0.5 for plotting purposes.)

