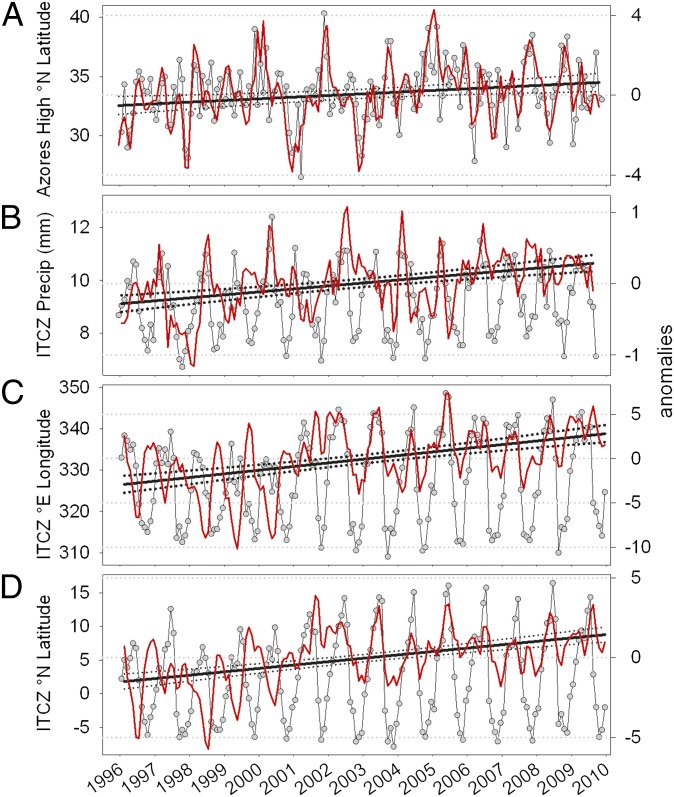
Fig. 4.
Temporal variations in the indices for the Azores High pressure center (A) and ITCZ (B–D) during the CARIACO time-series. (A) Monthly variations in the latitudinal position of the Azores High pressure COA. (B) Monthly variations in the South American precipitation index. Monthly variations in the longitudinal (C) and latitudinal (D) positions of the Tropical Atlantic ITCZ’s COA. Circles indicate mean monthly observations, and red lines are three-point running trimeans of computed anomalies used for regression analysis. Dotted lines enveloping slopes are 95% confidence intervals.

