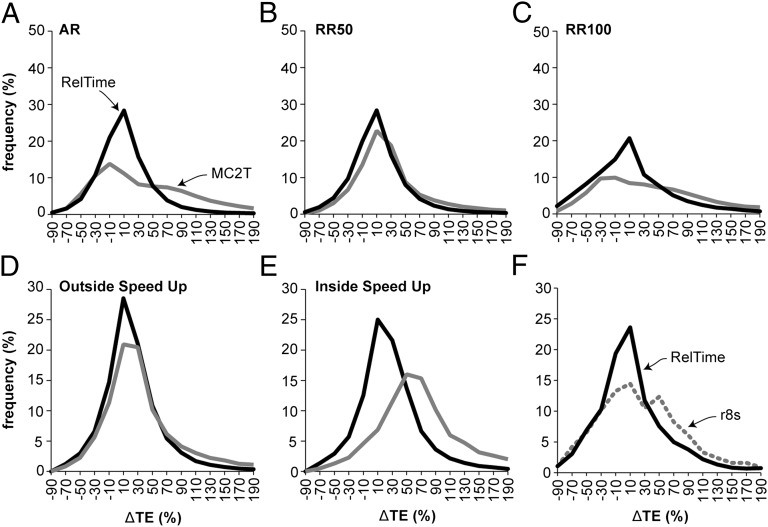
Fig. 5.
Distributions of the normalized differences between estimated and true TEs on branches. (A–C) Comparisons of RelTime (black curve) and MC2T (gray curve) performances for datasets simulated with AR and RRs (RR50, RR100). Relative performances of MC2T and RelTime for estimating times outside (D) and inside (E) the speed-up clades. (F) Comparison of the accuracy of RelTime (black solid) and r8s (gray dotted) for RR100 and RR50+50 datasets. The corresponding panels for relative node times (NTs) are shown in Fig. S1.

