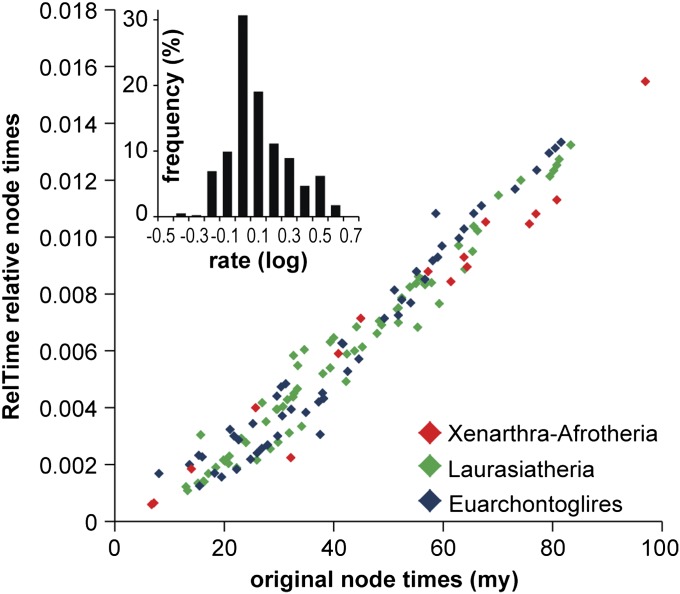
Fig. 6.
Comparisons of node times in RelTime (y axis) and MC2T (x axis) for the tree of 138 placental mammals, where marsupials were used to root the tree. Node times are relative estimates in RelTime and absolute values in MC2T (millions of years; My). Nodes in major clades are color coded by following Meredith et al. (4). Inset shows the distribution of relative evolutionary rates produced by RelTime, where the negative values indicate slower and positive values indicate faster rate than the ancestral average rate of 1. The skewness and kurtosis for the distribution of logarithmically transformed data (0.54 and 0.32, respectively) were much smaller than those for the raw data (1.73 and 3.51), indicating that the lognormal distribution is a better fit. The dataset analyzed consisted of an alignment of 11,010 amino acid positions (4). A JTT+Γ model was used in RelTime, as in ref. 4.

