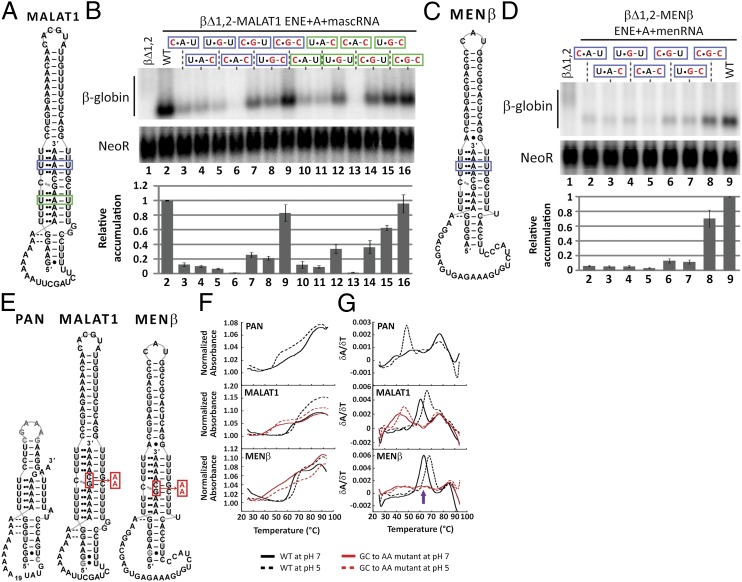
Fig. 2.
In vivo and in vitro biochemical evidence for an RNA triple-helical structure. (A and C) The same schematics as in Fig. 1A indicate the putative U•A-U base triples replaced with C•G-C in a blue (upper) or green (lower) box. (B and D) Northern blot analysis of β-globin and NeoR mRNAs (Upper) and quantitations (Lower) were performed as in Fig. 1C. Black nucleotides are WT sequence; mutated nucleotides are red. The WT βΔ1,2 reporter level was set at an arbitrary value of 1. Relative accumulation is the average of at least three independent experiments; error bars represent SD. (E) Schematic diagrams show the RNAs used in UV thermal denaturation experiments. The alignment of the PAN ENE core with A32GA2 is arbitrary. The red box and arrow denote the GC dinucleotide that was substituted with AA in MALAT1 ENE+A and MENβ ENE+A. (F) Plots of normalized absorbance at 260 nm versus temperature and (G) first derivative plots (δA/δT) versus temperature are shown for the PAN ENE core + A32GA2, the MALAT1 ENE+A WT and GC-to-AA, and the MENβ ENE+A WT and GC-to-AA mutant. Melting profiles of WT sequences are in black and the GC-to-AA mutant RNAs are in red. A solid line denotes pH 7; a dashed line denotes pH 5. Note that the MENβ ENE+A GC-to-AA mutant exhibits three transitions or peaks. The peak at 55–70 °C (purple arrow) shifted by several degrees in different experiments and once split into two defined peaks, making it difficult to explain its origin.

