Fig. 4.
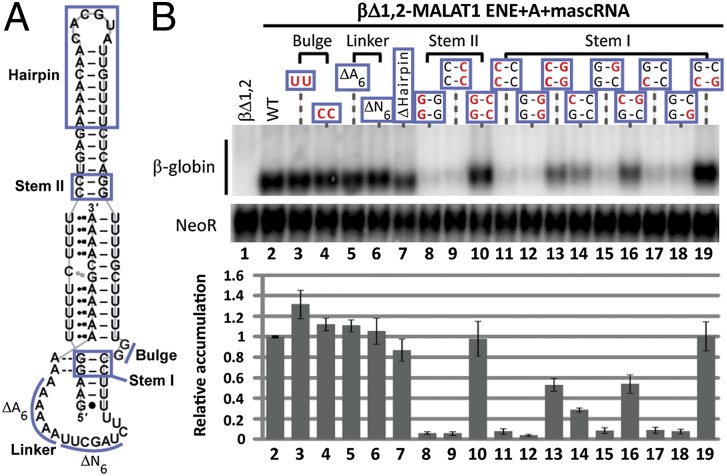
Other structural features contribute to stabilization. (A) The same MALAT1 schematic as in Fig. 1A has blue lines designating mutated regions. (B) Northern blot analysis of β-globin and NeoR RNAs (Upper) and quantitations (Lower) were performed as in Fig. 1C. WT nucleotides are black; mutated nucleotides are red. The delta (Δ) symbol represents a nucleotide deletion. In Δhairpin, a GCAA tetraloop was substituted to maintain a predicted stem-loop structure. The WT βΔ1,2 reporter level was set at an arbitrary value of 1. Relative accumulation is the average of at least three independent experiments; error bars represent SD.

