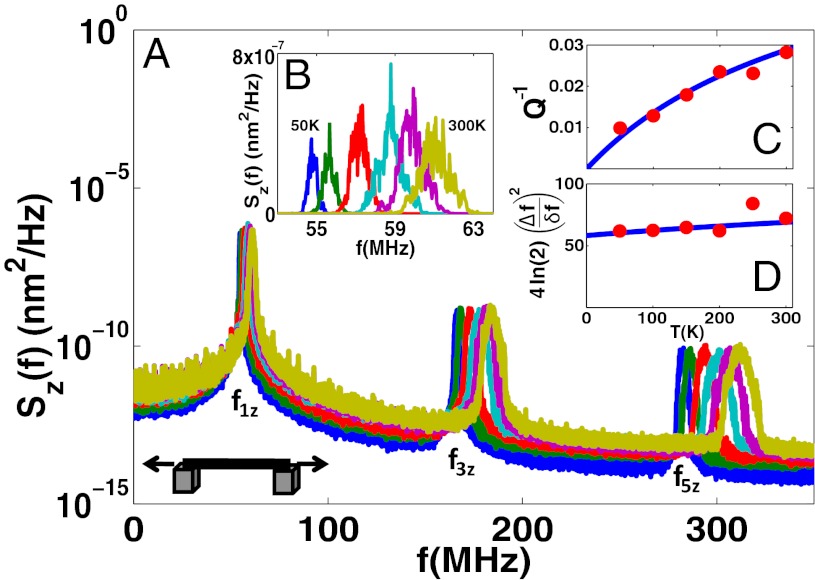
Fig. 2.
(A) Power spectral density of a tensioned nanotube with ɛ0 = 2 × 10⁻⁴. Six temperatures are plotted from 50 to 300 K spaced evenly in T. (B) Linear plot of Sz (f) for f1z showing that the frequency shift Δf and line width δf both scale linearly with T. (C) Inverse quality factor of f1z vs. temperature. (D) Dimensionless fixed ratio of Δf to δf that corresponds to nf, the number of independent fluctuating modes contributing to spectral broadening and frequency shifts. In C and D, data are circles, and theory is a line. The line in C corresponds to Eq. 2, and in D nf in Eq. 1.

