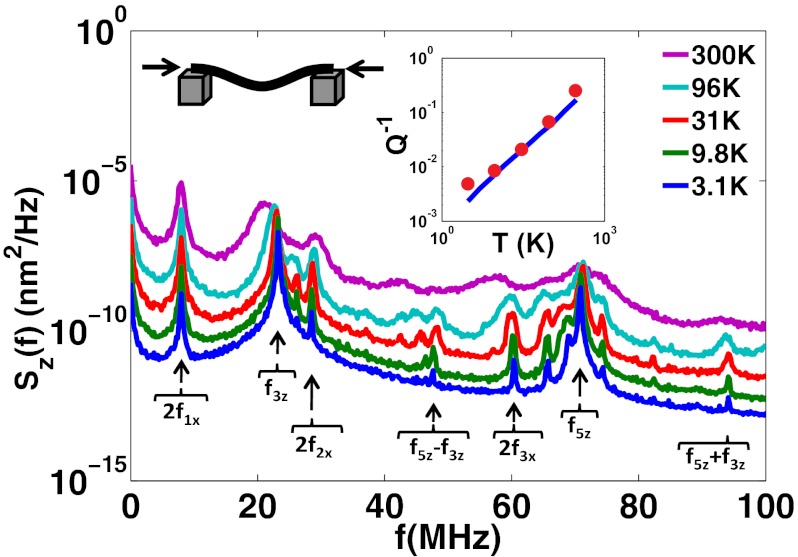
Fig. 3.
Power spectral density of buckled nanotube with ɛ0 = −4 × 10⁻³ with Fz = 0.6 pN at logarithmically spaced temperatures. The built-in intrinsic damping dominates the apparent line width at the lowest temperature. (Inset) Plot of Q−1 of the f3z mode. Simulation data are shown as red dots, and theoretical predictions from Eq. 3 are plotted as a blue line. Labels beneath each spectral line correspond to their expected origin.

