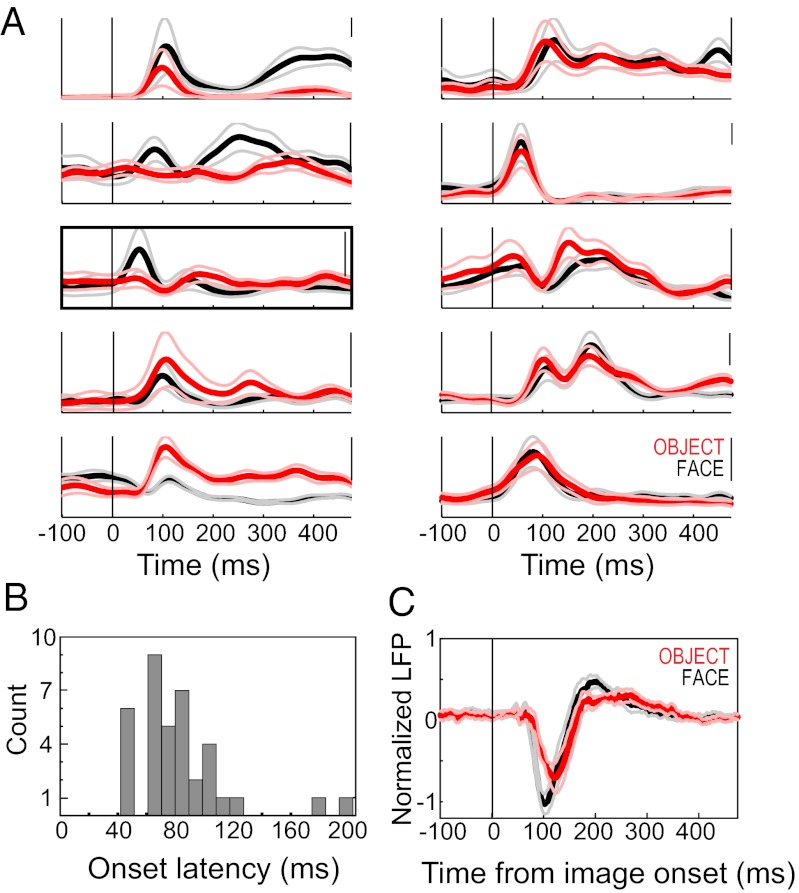
Fig. 1.
Neural responses to face and object stimuli. (A) Spike-density functions showing the average firing rate of responses to faces (black) and objects (red), in example single units. Thin lines indicate 95% confidence intervals, and the 100-Hz rate is indicated on the scale bar at the top right of each plot. (Left) Responses that were greater for faces (top two traces), objects (bottom two traces), and both, but at different times after image onset. In the middle trace, the bracket designates the example shown in Fig. 2. (Right) Units that were responsive to face and object stimuli but were not category-selective. (B) Histogram of spike response latencies for faces and objects. (C) Mean normalized LFP response to faces (black) and objects (red) of the STS recording sites used in this study (n = 26). Thin lines indicate ±1 SEM for each response category. The LFP responses were generally conserved across sites; thus, the mean LFP is a good indicator of the evoked response from any given site.

