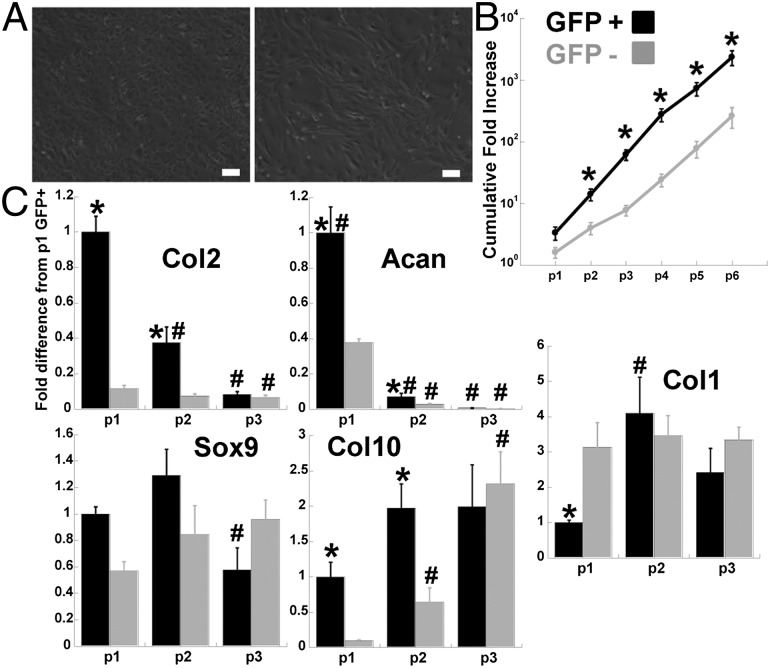
Fig. 2.
Monolayer expansion of sorted cells. (A) Passage 2 cells after sorting for GFP+ (left) or GFP− (right). (Scale bar: 100 µm.) (B) Cumulative fold increase in cell number (log scale). Asterisk indicates P < 0.05 to GFP− of same passage, n ≥ 3 per group, mean ± SEM. (C) RT-PCR. Fold increase normalized to passage 1 GFP+ cells, asterisk indicates P < 0.05 to GFP− of same passage and pound indicates P < 0.05 to passage 1 of own cell type, n ≥ 3 per group, mean ± SEM.

