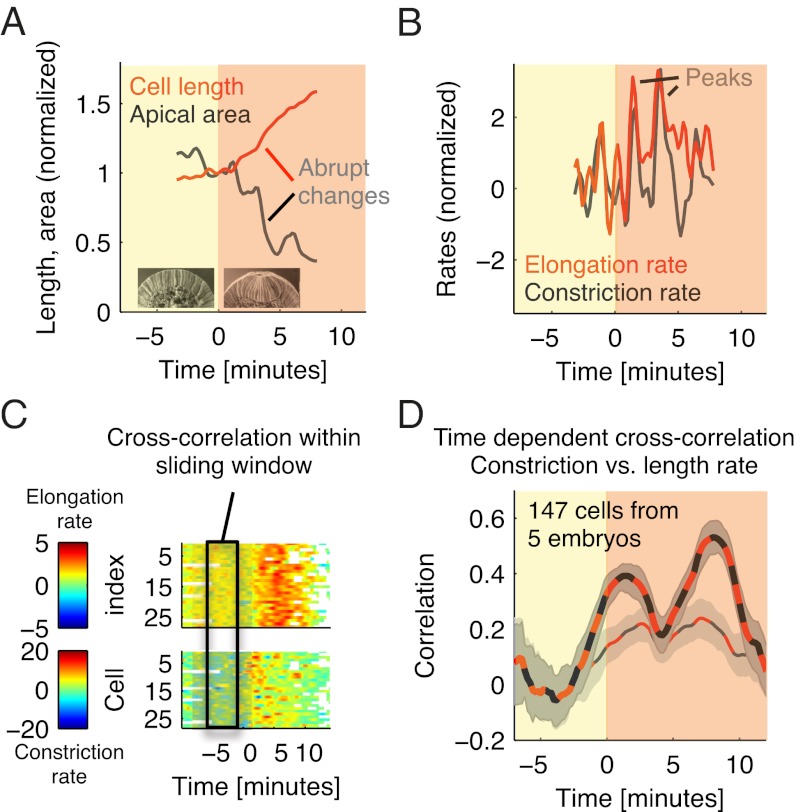
Fig. 3.
Phases of pronounced cell lengthening are correlated with pulses of apical constriction. (A and B) Cell length and apical surface area (A) and elongation and constriction rates (B) for a representative cell. To facilitate comparison, quantities were normalized by the length and apical area at t = 0, respectively. (C) To estimate the statistical dependency between the two rates in individual cells, we computed their (zero-lag) cross-correlation in a temporally moving window of length of 6 min. (D) The thick red/black dashed line marks the mean correlation, and the dark gray shade shows the (2, 98) percentile confidence interval obtained by bootstrap resampling based on 147 cells near the midline from five embryos (Materials and Methods). Also shown is the correlation after high-pass filtering the data using a Gaussian filter with σ = 2 min (thin red/black dashed line with bright gray shaded confidence intervals).

