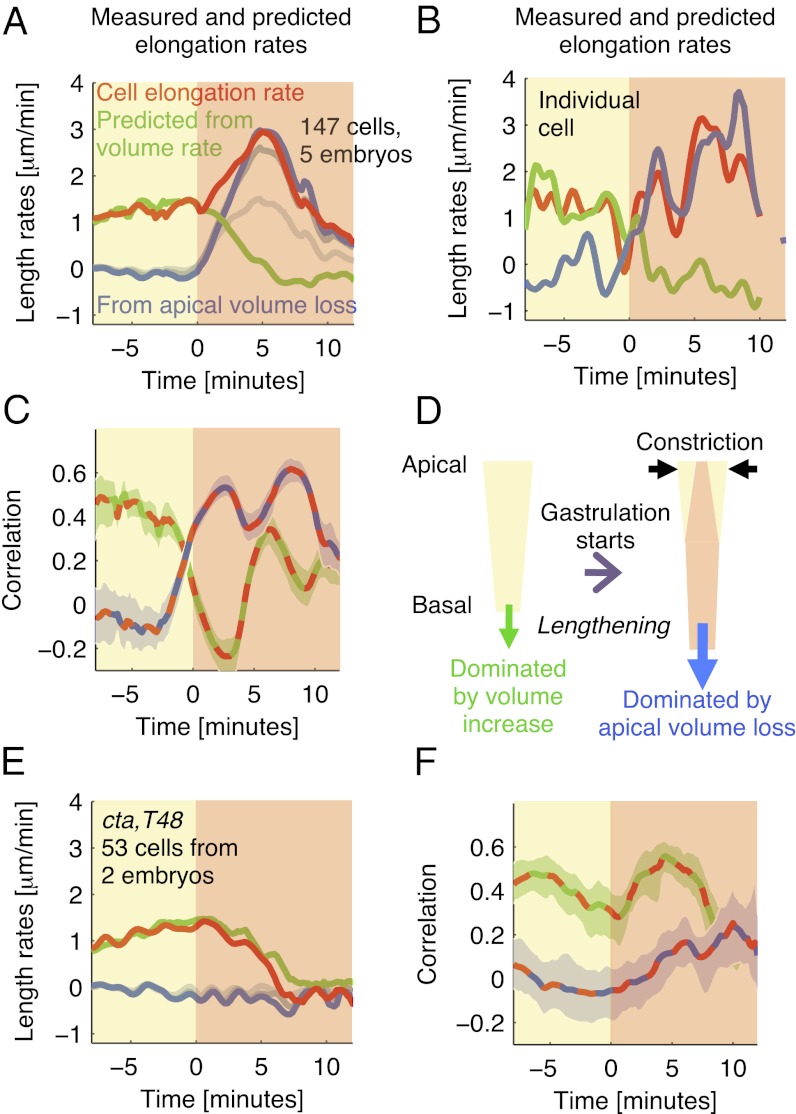
Fig. 4.
Constriction-induced apical volume loss predicts rate of cell lengthening. (A) Average measured cell elongation rate (red) compared to rates predicted from total volume change (green) and from constriction-induced apical volume loss [blue; gray curves, alternative definitions (see text)]. (B) The three rates for an individual representative cell. (C) Time dependent cross-correlations (described in Fig. 3C) between the cell elongation rate and the two predicted rates (red/green dashed line, prediction from total volume change; red/blue dashed line, prediction from apical volume loss). Analysis in A and C is based on same cells as in Fig. 3D. (D) Model: dominant factors in determining cell lengthening during cellularization and gastrulation. (E and F) Data for cta; T48 mutants presented as in A and C, respectively.

