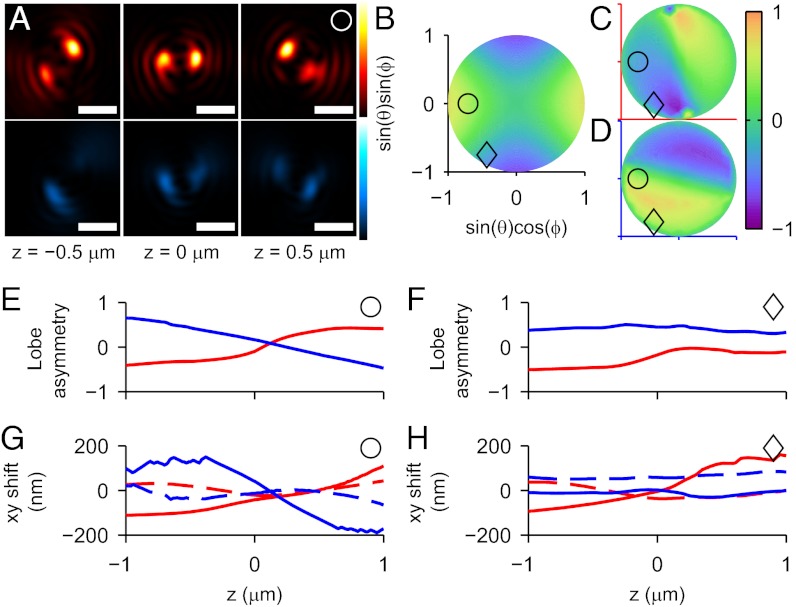
Fig. 2.
Simulated behavior of the DH-PSF response to dipole orientation. (A) Example DH-PSF images of a molecule with orientation (θ = 45°, ϕ = 180°) at several z positions. Upper (red) shows images that appear in the parallel polarization channel, whereas Lower (blue) shows images from the perpendicular polarization channel (definitions in the text). (Scale bar: 1 μm.) (B) A z cross-section (z = −500 nm) of LD as a function of (θ, ϕ), where (θ, ϕ) are projected into rectangular coordinates according to the relations marked on the axes. The center of the plot corresponds to a dipole aligned with the optical axis (θ = 0°), whereas the perimeter of the plot corresponds to molecules with θ = 90°; ϕ is the azimuthal angle from the positive x axis that increases in a counterclockwise direction. The points marked with ○ and ◇ correspond to the orientations (θ = 45°, ϕ = 180°) and (θ = 60°, ϕ = −120°), respectively. (C and D) Corresponding plots showing the functional behavior of LA vs. orientation for constant z = −500 nm in the parallel (C; red axes) and perpendicular (D; blue axes) channels, respectively. (E) LA vs. z in the parallel (red) and perpendicular (blue) channels for a fixed example dipole orientation (○). (F) The same plot for a different orientation (◇). (G) Δx (solid line) and Δy (dashed line) vs. z in the two channels for the ○ orientation. (H) The same plot for the ◇ orientation.

