Fig. 3.
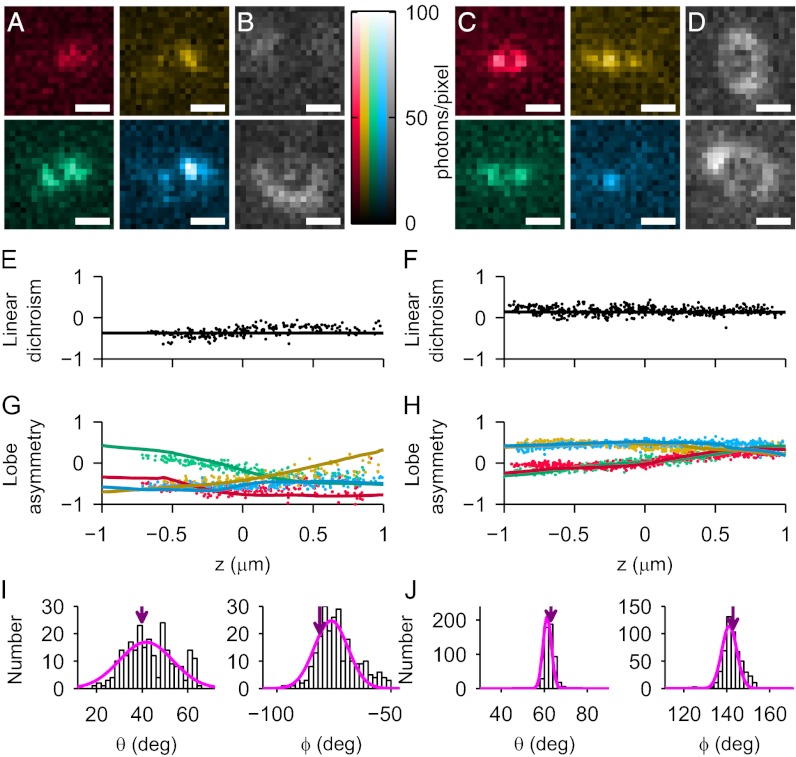
Orientation fitting results for example molecule 1 (A, B, E, G, and I) and example molecule 2 (C, D, F, H, and J). (Scale bars: 1 μm.) (A) Four example DH-PSF images (which constitute one measurement of orientation) of molecule 1 at z ∼ −250 nm as it appears in each of four mask orientation/polarization channel combinations: red, gold, green, and blue (definitions in the text). Note that only one lobe is easily visible in the red and gold channels. (B) The transmitted (Upper) and reflected (Lower) polarization defocused standard PSF images used for independent orientation measurement. (C) The equivalent of A for example molecule 2 at z ∼ 0 nm. (D) The equivalent of B for example molecule 2. (E and F) Each measurement of LD (scatter points) and the predicted LD based on the mean fit orientation (solid line) for each molecule. (G and H) Each measurement of LA in each channel (color code is the same as in A) and the overlaid predicted LA for the mean fit orientation. (I and J) Histograms of θ and ϕ extracted from DH-PSF based measurements. Magenta line is Gaussian fit. Purple arrow denotes orientation extracted from defocused imaging.

