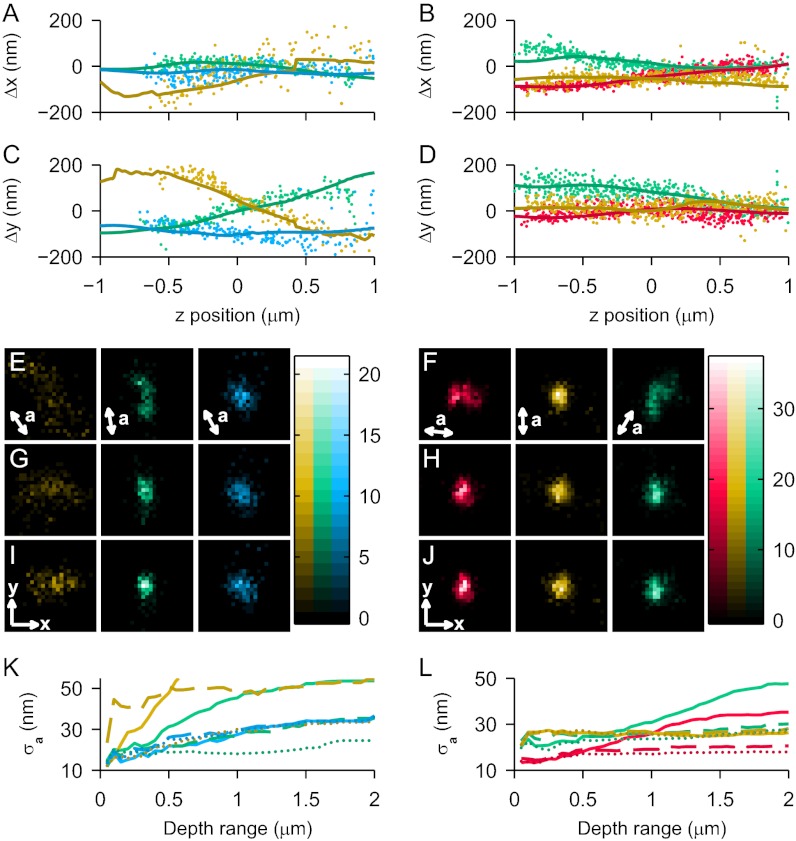
Fig. 4.
Measured and predicted (Δx, Δy) caused by dipole orientation effects for example molecule 1 (A, C, E, G, I, and K) and molecule 2 (B, D, F, H, J, and L). Color code is the same as in Fig. 3. (A–D) Measured (scatter points) Δx and Δy vs. z for each example molecule, with overlay (solid line) of simulated shift based on the mean extracted orientation. For each molecule, one mask orientation/polarization combination did not produce meaningful localizations because of low signal and/or high LA (omitted channels). (E and F) 2D histogram of uncorrected (xapparent, yapparent) localizations over the 2-μm DR. In each panel, a is the predominant direction of lateral shift for that mask orientation/polarization channel. Bin size, 15 nm. (G and H) Corresponding 2D histograms of the corrected localizations as produced by subtracting each predicted (Δx, Δy) based on each individual estimation of (θ, ϕ). (I and J) The corrected 2D histograms produced by subtracting the predicted (Δx, Δy) based on the average estimation of (θ, ϕ). Displayed (x, y) axes are 100 nm in length. (K and L) Additional quantification of the improvement in lateral localization showing σa, the SD along the direction a in each channel, as a function of DR about the focal plane. We compare σa calculated for the uncorrected case (solid line), the individual measurement-based correction (dashed line), and the average-based correction (dotted line).

