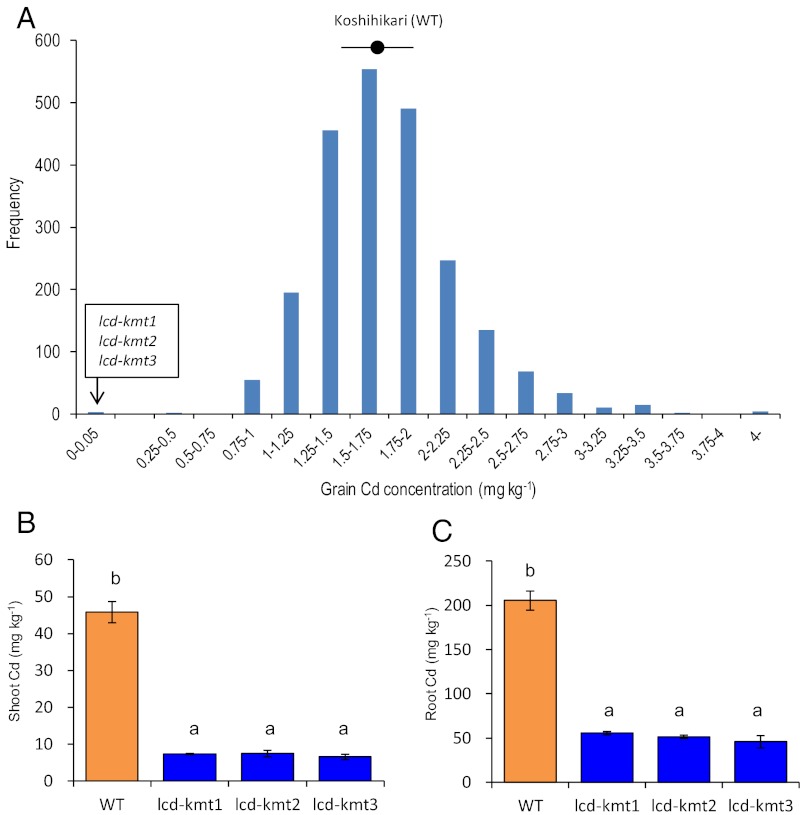
Fig. 1.
(A) Frequency distribution of grain Cd concentration in rice mutants (2,592 M2 plants) grown in pots filled with Cd-contaminated soil. The circle and range bar represent the mean and SD of grain Cd concentration in Koshihikari (288 plants). (B and C) Cd concentrations in the shoots and roots of WT Koshihikari and of three low-Cd Koshihikari mutants (lcd-kmt1, lcd-kmt2, and lcd-kmt3) grown in hydroponic culture containing 0.18 µM Cd. Bars labeled with different letters differ significantly (P < 0.05, ANOVA followed by Tukey's test).

