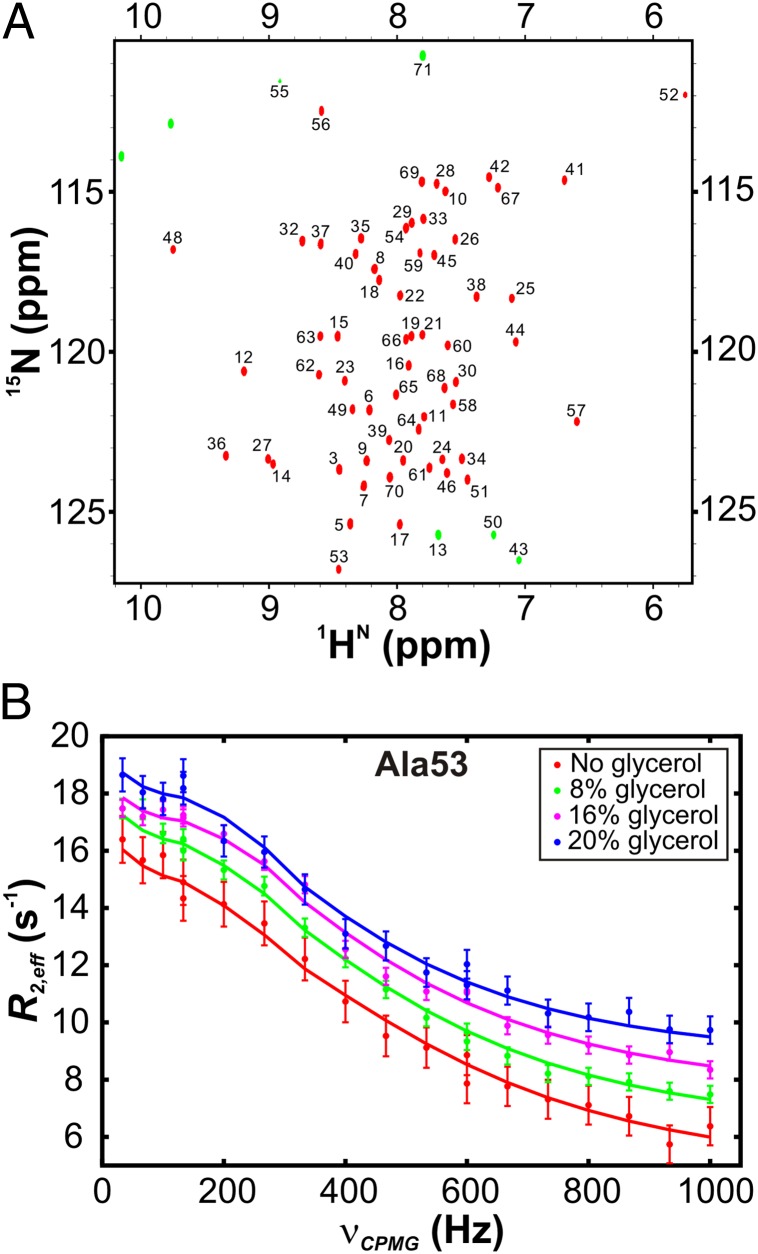
Fig. 2.
NMR spectroscopic methods for analyzing wt FF domain folding from the intermediate state. (A) 1H,15N HSQC spectrum of the wt FF domain, with assignments of residues as indicated (46). Aliased cross-peaks in the dataset are shown as green contours. (B) 15N relaxation dispersion curves acquired at 18.8 T for Ala53 at four different viscogen concentrations, 25 °C. Solid lines are global best fits to a two-state exchange model between N and I at each viscogen concentration.

