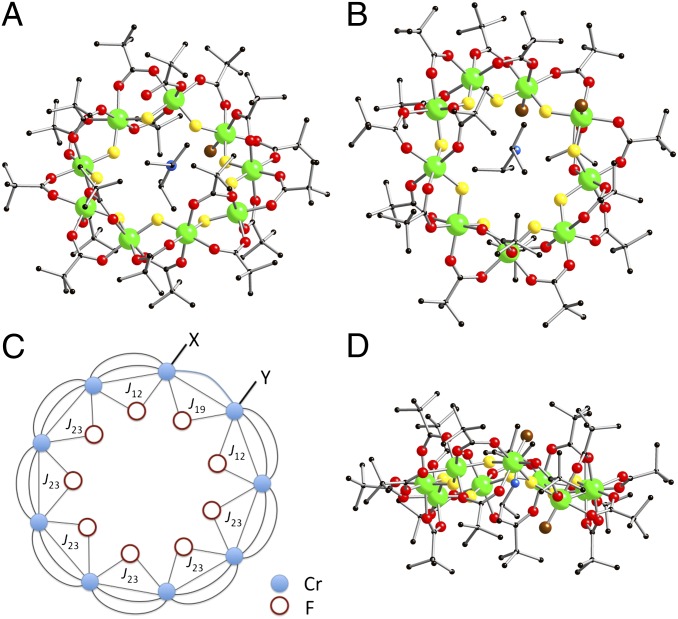
Fig. 1.
The structures of (A) 3 and (B) 4 in the crystal, viewed close to perpendicular to the plane of the nine Cr centers. (C) A schematic representation of the structure, with the magnetic exchange interactions used in Hamiltonian (Eq. 1) included. (D) A view of 4 looking into the unique edge, showing the arrangement of terminal ligands. Colors: Cr, green; O, red; N, blue; C, black; bridging F, yellow; terminal F, brown.

