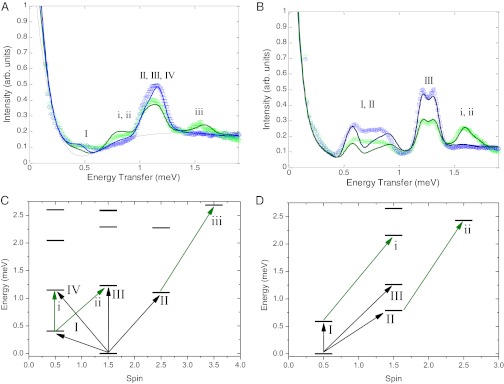
Fig. 3.
INS studies and energy levels for 3 and 4. (A and B) INS energy spectra for 3 and 4, respectively, measured with a 5.0-Å incident neutron setting at 1.5 (blue open circles) and 6.0 K (green open circles). The solid lines represent spin Hamiltonian simulations as described within the text. The labels correspond to the transitions marked in C and D. (C and D) Low energy spin multiplets as a function of their total spin for the isotropic exchange Hamiltonian for 3 and 4, respectively.

