Fig. 3.
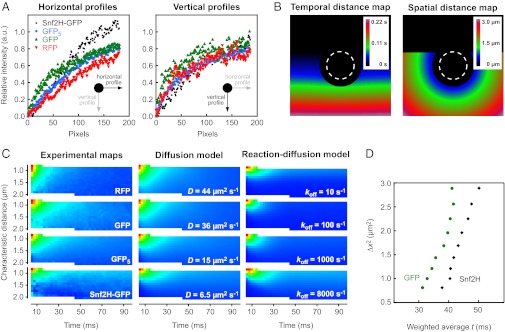
Translocation probabilities for Snf2H-GFP, GFP, RFP, and GFP5. (A) Horizontal and vertical profiles around the bleach spot differ due to the asymmetry introduced by the raster scan process. Different protein mobility leads to different profiles. a.u., arbitrary units. (B) Each pixel has a defined characteristic spatial and temporal distance from the set of bleach events. Pixels at the bottom are acquired later than pixels in the center of the image. (C) Characteristic spatial and temporal distances can be used to derive the effective translocation probability, P(∆x,∆t). This distribution depends on the protein mobility as shown for the experimental bleach profiles of the different proteins used here. Theoretical profiles show similar probability distributions. (D) Based on the translocation probabilities, the characteristic translocation time can be calculated as the weighted average along the time axis. The resulting diagnostic plots visualize the particle’s mobility on different length scales.

