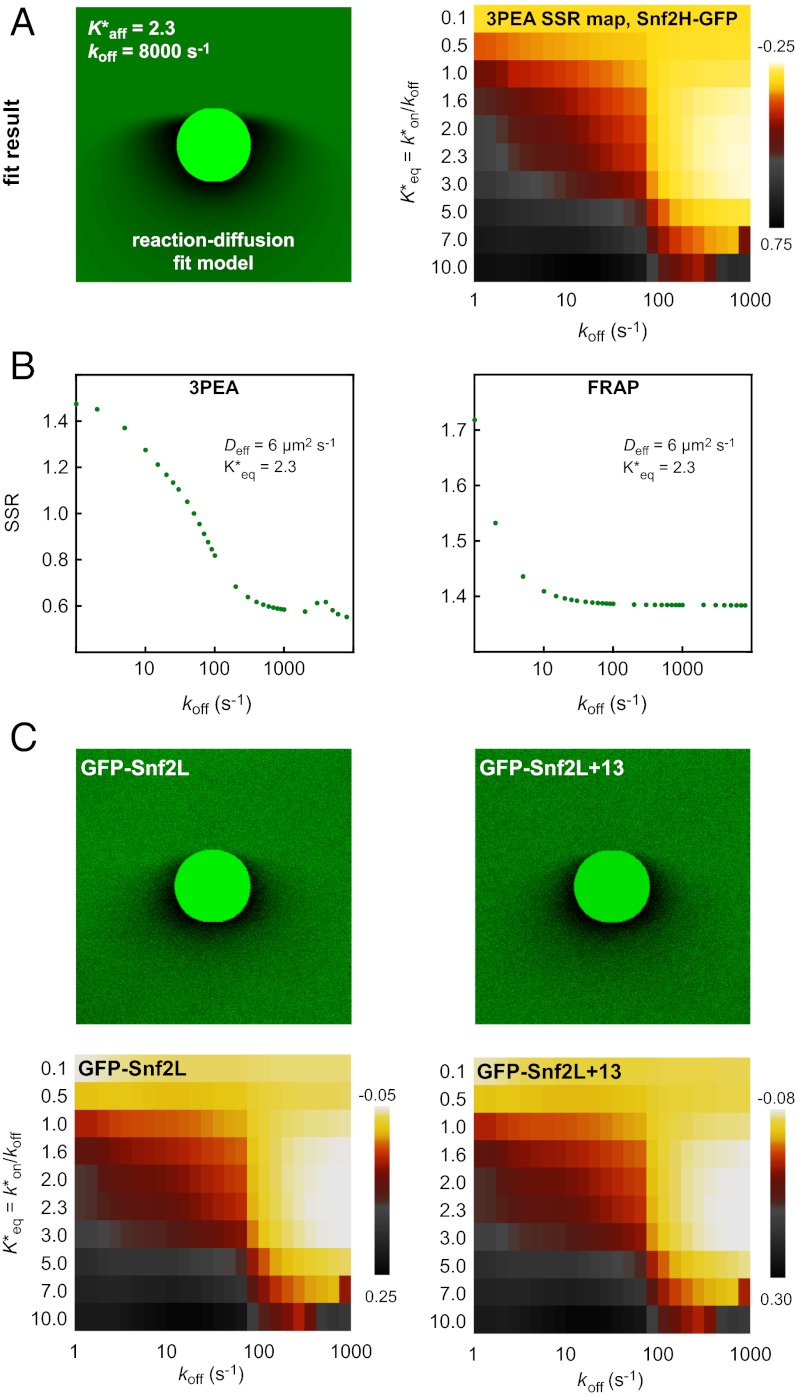
Fig. 5.
Dissociation constants measured by 3PEA. (A) The bleach profile for Snf2H-GFP was fitted against a library with different dissociation rates. The calculated profile that yielded the best fit and the logarithmic SSR map for different dissociation rates and pseudoequilibrium binding constants are shown. (B) The SSR plot for Snf2H-GFP displayed a global minimum at  = 2.3 and koff > 500 s−1, corresponding to residence times of less than 2 ms. (C) The same analysis was conducted for GFP-Snf2L and GFP-Snf2L+13, yielding very similar SSR maps and best fits for
  = 2.6 and rate constants koff > 600 s−1.

