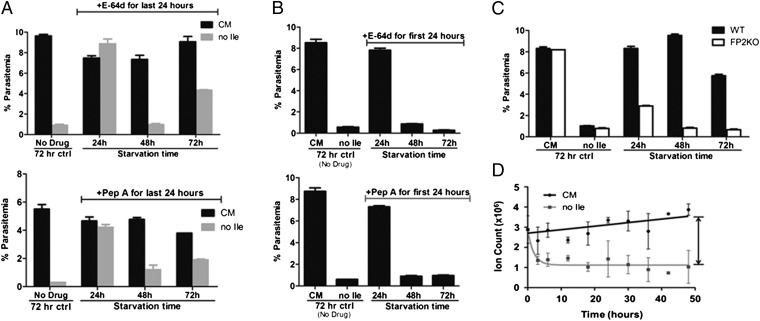
Fig. 2.
Protease activity is required to maintain viability during isoleucine starvation. (A) Synchronous 3D7 parasites were fed (black bars) or starved for isoleucine (gray bars) for the indicated times in the presence of 10 μM E-64d (Upper) or 5 μM pepstatin A (Pep A, Lower) for the last 24 h of the incubation. After drug removal, each culture was replated in CM for recovery. Parasitemia of all cultures was measured by flow cytometry after 72 h of recovery. A control set of parasites, shown on the far left of each graph, was grown in the absence of drug for 72 h. Data shown represent the mean parasitemia ± SEM; n = 3. (B) Synchronous 3D7 parasites were starved for isoleucine for the indicated times in the presence of 10 μM E-64d (Upper) or 5 μM pepstatin A (Pep A, Lower) for the first 24 h of the incubation. After drug removal (and extended starvation for the 48-h and 72-h samples), parasites were replated in CM for recovery. Parasitemia of all cultures was measured by flow cytometry after 72 h of recovery. A control set of parasites was fed (CM) or isoleucine-starved (no Ile) in the absence of drug for 72 h. Data shown represent the mean parasitemia ± SEM; n = 3. (C) Growth recovery after isoleucine resupplementation of synchronous 3D7 (WT, black bars) and fp2 knockout (FP2KO, white bars) parasites incubated in Ile-free RPMI for the indicated times. Control parasites were fed (CM) or starved for isoleucine without refeeding (no Ile) for 72 h. Parasitemia of all cultures was measured by flow cytometry after 72 h of recovery. Data shown represent the mean parasitemia ± SEM; n = 3. Each experiment was repeated at least three times. Representative experiments are shown. (D) Intracellular isoleucine content of fed (CM) and isoleucine-starved (no Ile) parasites over time. Extracts of 3D7 infected-erythrocyte cultures were analyzed via LC/MS. Signal from uninfected erythrocyte (cultured under the same conditions) extracts was subtracted from the infected-erythrocyte signal. The data are presented as the total ion count detected for derivatized isoleucine. Curves were fitted using the equation Y = (Y0 - P)*exp(-K*X) + P, where P is the Y value at infinite times and K is the rate constant. Data shown represent the mean ± SD, n = 2.

