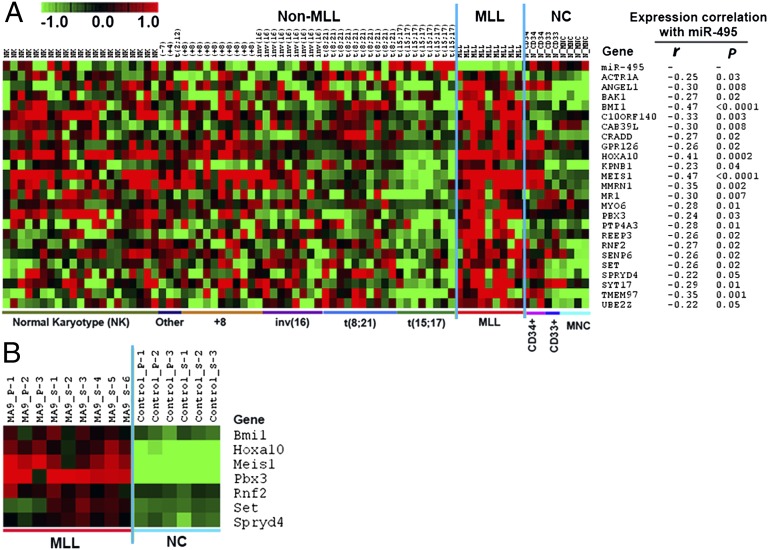
Fig. 4.
Expression profiles of candidate target genes of miR-495. (A) Expression profiles of the 24 candidate target genes of miR-495 and their expression correlation with miR-495 in the set of 79 human samples (including 9 MLL-rearranged AML, 61 nonMLL-rearranged AML, and 9 normal control). r, correlation coefficient; P, P value. Pearson correlation was applied to analyze the correlation. (B) Expression profiles of the seven potential target genes of miR-495 in the set of 15 mouse BM cell samples collected from mouse BM transplantation assays, which include 9 MLL-AF9 mouse leukemic BM cell samples (3 from primary BM transplantation and 6 from secondary BM transplantation recipient mice) and 6 normal control BM cell samples (3 each from primary and secondary BM transplantation recipient mice). MA9, MLL-AF9; _P, primary transplantation recipient mouse; _S, secondary transplantation recipient mouse. Expression data were mean centered, and the relative value for each sample is represented by a color, with red representing a high expression and green representing a low expression (scale shown at upper left).

