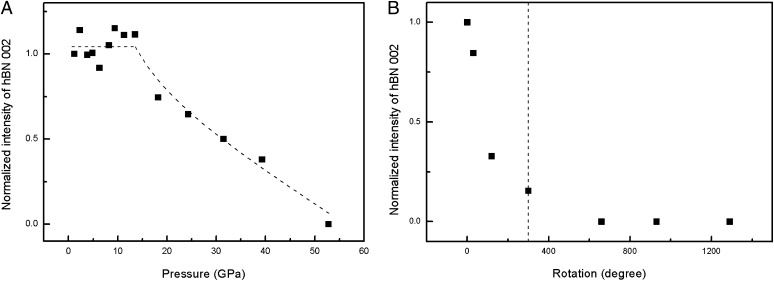
Fig. 3.
(A) Pressure-dependent relative intensity of the hBN (002) peak. Normalization was done against the intensity of the (002) peak at 1.2 GPa. The dashed line serves as a visual guide. (B) Normalized intensity of the hBN (002) peak versus rotation angle of an anvil. Normalization was done against the integrated intensity of the hBN (002) peak of the pattern at 7.2 GPa without rotating. The dashed line indicates the rotation angle at which phase transition started.

