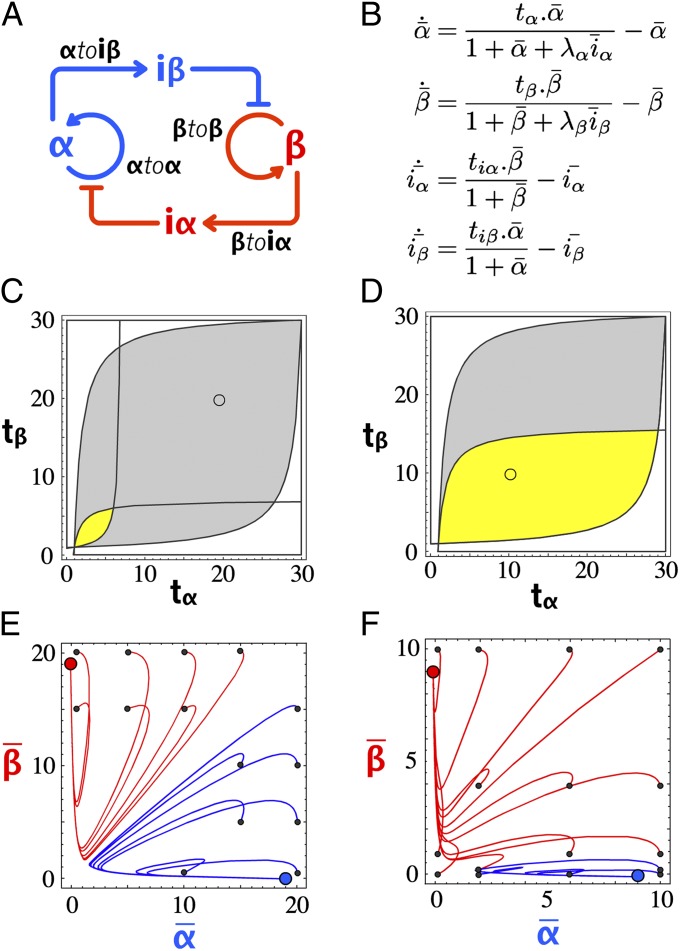
Fig. 2.
Bistable circuit design. (A) Circuit encoding bistability. (B) Nondimensionalized equations of the simplified model: tx is the scaled template concentration, and λx is the ratio of activator over inhibitor binding constant. Periods indicate multiplications. (C) Phase diagram of the bistable circuit in the {tα, tβ} plane, with yellow indicating the bistable domain for {λα, λβ} = {20, 20} and gray indicating the bistable domain for {λα, λβ} = {100, 100}. (D) Same as in C, with yellow indicating the bistable domain for {λα, λβ} = {100, 50} and gray indicating the bistable domain for {λα, λβ} = {100, 100}. (E) Plot of the calculated trajectories of the bistable circuit for different initial { ,
,  } (small black dots). The bistable circuit is evolving to a stable state A (blue dot) or B (red dot). {λα, λβ} = {100, 100} and {tα, tβ} = {20, 20}, corresponding to the small circle in the gray area of C. (F) Same for {λα, λβ} = {100, 50} and {tα, tβ} = {10, 10}, corresponding to the small circle in the yellow area of D).

