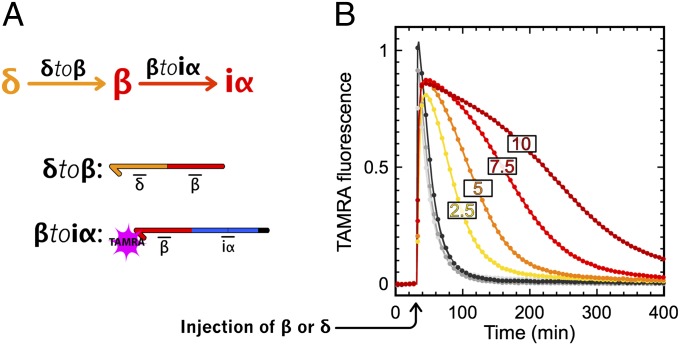
Fig. 5.
Production of β by activation module δtoβ. (A) Circuit and templates of the system. (B) Experimental time plot of TAMRA fluorescence (baseline removed) produced by the hybridization of β on βtoiα. Gray curves correspond to the injection of 30–150 nM β. Yellow to red correspond to the injection of 30 nM δ in the presence of 2.5, 5, 7.5, or 10 nM δtoβ.

