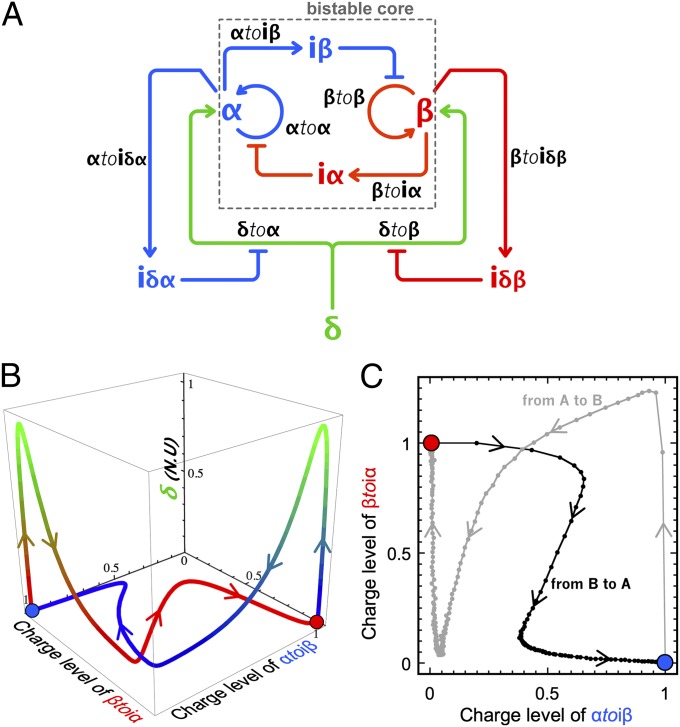
Fig. 7.
(A) Circuit of the push-push memory: A single external input δ controls the bistable core. (B) Calculated 3D trajectories in the space {charge level of αtoiβ, charge level of βtoiα, total concentration of δ in normalized units (N.U.)} for the push-push memory switching from A to B (blue) and B to A (red). Normalized values of δ (injected as a Gaussian spike) from 0 to 1 are associated with a color gradient ranging from blue/red to green. (C) Experimental trajectories of the push-push memory circuit show two independent experiments: one in which the system is initially set on the state A and then flipped to B upon injection of 30 nM δ and another in which the same system is set in state B and then flipped to A upon injection of the same input. The charge level of βtoiα higher than 1 indicates that the amount of β transiently produced by activation module δtoβ during switching exceeds the concentration of β at the stable state B.

