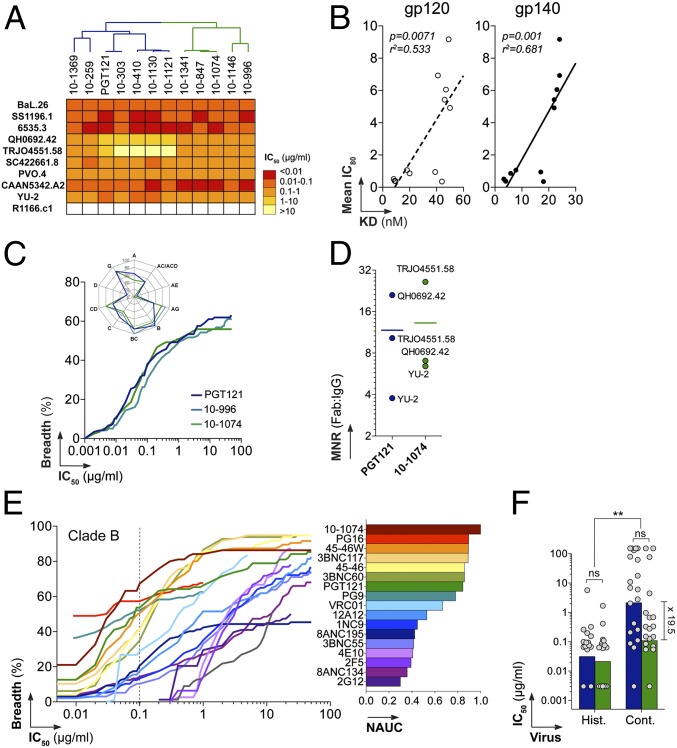
Fig. 2.
Neutralization activity of PGT121-like and 10-1074–like variants. (A) Heat map comparing the neutralization potencies of PGT121-like and 10-1074–like antibodies (listed at the top with a dendrogram showing relationships; Fig. 1A) in the TZM-bl assay. Darker colors, more potent neutralization; white, no neutralization. (B) Correlation between the mean IC80 against nine viruses (y axis) and apparent KD values for binding to gp120 and gp140 (x axis). (C) Graph comparing the neutralization breadth and potencies of PGT121, 10-996, and 10-1074 antibodies in the TZM-bl assay against an extended panel of 119 viruses. The y axis shows the cumulative frequency of IC50 values up to the concentration shown on the x axis. The spider graph (upper left) shows the frequency distribution of neutralized viruses according to HIV-1 clades. (D) Dot plot showing molar neutralization ratios (MNRs) (ratio of the Fab and IgG IC50 concentrations). Horizontal bars represent the mean IC50s for all viruses. (E) Coverage graph (as in C) comparing the neutralization breadth and potencies of selected bNAbs against a panel of 95 clade B viruses as evaluated by the PBMC-based neutralization assay. (Right) Bar graph showing values for the normalized area under the curve (NAUC) for the IgGs shown in the coverage graph. (F) Bar graph comparing the neutralization potencies of PGT121 (blue) and 10-1074 (green) against viruses isolated from historical (Hist.) and contemporary (Cont.) seroconverters. ns, nonsignificant; **P < 0.005. Fold difference between median IC50s for the neutralization of contemporary viruses by PGT121 and 10-1074 is indicated.

