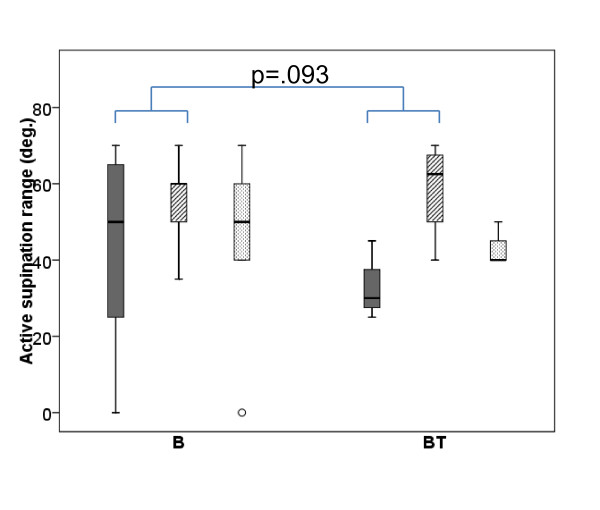
Figure 4.
Forearm supination. Box-plot for active forearm supination range in degrees (deg.). Baseline Post 2 months Post 5 months measures’ with Baseline (solid/dark grey) Post 2 months (striped grey) Post 5 months (dotted/light grey) measures for group B (receiving Botulinum Toxin-A) and group BT (receiving Botulinum Toxin-A + 8 weeks of resistance training). Boxes are inter-quartile ranges, the solid horizontal line is the median, whisker bars are the extreme values. Outliers are shown as circles. Significant group differences in treatment effect are indicated.

