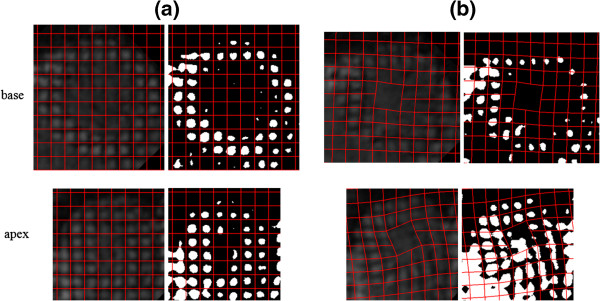
Figure 4.
LV wall at the (a) beginning and (b) end of systole as it twists at the base (slice # 9) and apex (slice # 4) levels in opposite orientations. The background images on the left are the tagged images of the LV wall and those on the right are the corresponding binary images. The LV wall rotates counter clockwise at the base and clockwise at the apes when viewed from the head-to-toe direction. The meshes of the red lines superimposed on the tagged images are the model predictions of the motions.

