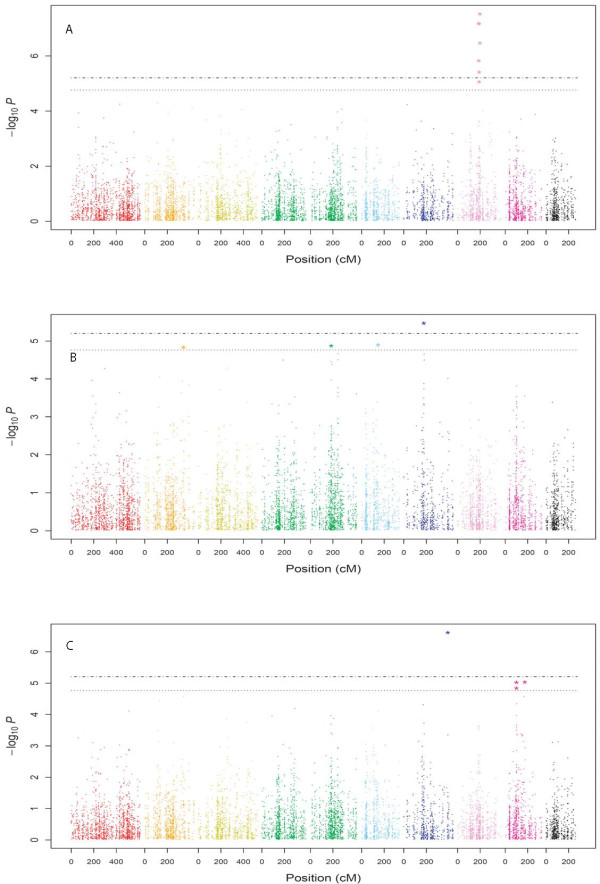
Figure 3.
Genome-wide P values for association analysis of flowering time (FT; A), northern corn leaf blight (NCLB; B), and FT corrected NCLB resistance (C) for the entire set of 1487 maize inbred lines. The ten colors represent the ten chromosomes. The horizontal, doted and dashed-doted lines correspond to a nominal 5% significance threshold with Bonferroni and amplicon-wise Bonferroni correction, respectively. Significant P values are represented by a star.

