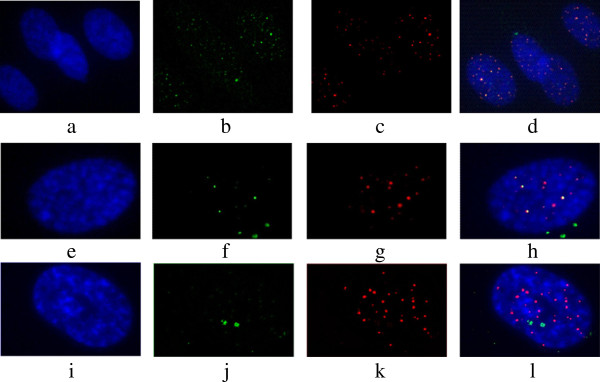
Figure 4.
Representative images of cell nuclei with or without telomere dysfunction-induced foci (panels a-l). (a-h) Representative examples of FANCD2 nuclei with TIFs. (a, e) DAPI (b, f) γ-H2AX, (c, g) Telomeres and (d, h) Merged. When green and red signals overlap (merge) a yellow pattern is seen, indicating co-localisation of γ-H2AX with telomeres (i-l) Control cell nuclei with distinct γ-H2AX and telomere signals (no TIFs), (i) DAPI, (j) γ-H2AX, (k) Telomeres and (l) Merged. Zeiss-Axioimager A1 microscope equipped with a CCD camera, Axiocam image acquisition software (Imaging Associate) and software package from MetaSystem were used for analysis.

