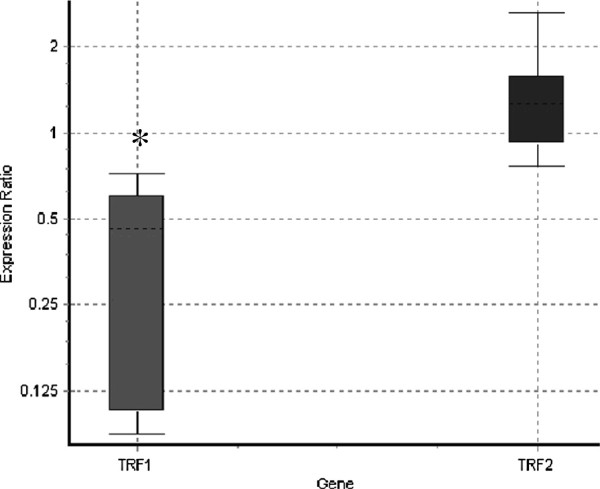
Figure 6.
The relative expression of shelterin compounds TRF1 and TRF2 mRNA in FANCD2 (n = 4) and control fibroblasts (n = 6). The relative level of TRF1 and TRF2 mRNA was standardized against the housekeeping gene 18 s rRNA and calculated using relative expression software tool, REST 09. The squares represent relative expression of TFR1 and TRF2 in FANCD2 cells versus control cells. The box area in a whisker-box plot encompasses 50% of all observations, the dotted line represents the sample median and the whiskers represent the outer 50% of observations.

